


 nueva página del texto (beta)
 Inglés (pdf)
 Artículo en XML
 Referencias del artículo
 Enviar artículo por email
 Citado por SciELO
  Similares en
SciELO
Similares en
SciELO 
 Permalink
1 Introduction
Enhancing contrast is important across multiple domains, including image processing, pattern recognition, and computer vision.
This process enables us to enhance image clarity, rendering them more apt for subsequent analysis and manipulation. In recent years, advanced optimization techniques utilizing metaheuristics have emerged for efficiently configuring transformation function parameters in image contrast enhancement.
Hoseini et al. [12] proposed a hybrid algorithm integrating Genetic Algorithm (GA) [10], Ant Colony Optimization (ACO) [9], and Simulated Annealing (SA) [18], enhancing image contrast while preserving natural appearance.
Kallel et al. [14] enhanced dark Computed Tomography scans using a Discrete Wavelet Transform-Singular Value Decomposition (DWT-SVD) approach followed by Adaptive Gamma Correction (AGC), suitable for low-contrast images. Applied the Artificial Bee Colony (ABC) algorithm, Chen et al. [6] introduced a novel objective function to evaluate enhanced image quality, resulting in enhanced image contrast.
Kanmani and Narasimhan [16], enhanced grayscale image contrast with Particle Swarm Optimization (PSO), revealing hidden details, ideal for nighttime imagery. Kamoona et al. [15] proposed an enhanced cuckoo search algorithm for automatic contrast enhancement, targeting Local/Global Enhancement transformation (LGE).
Other studies have introduced contrast enhancement techniques with automated parameterization. For instance, Surya et al. [27] utilized a GA and a fuzzy intensification operator, while Guraksin et al. [11] employed wavelet transform and the Differential Evolution (DE) algorithm. Malik et al. [20] enhanced images using the sigmoid function and PSO for maximizing information content while preserving intensity through gamma correction. Rao et al. [23] enhanced magnetic resonance imaging contrast using modified histogram equalization with Fuzzy-Improved PSO (FIPSO), achieving notable improvements in brightness and contrast. Ahmed et al. [2] presented a method to enhance grayscale images using the Barnacles Mating Optimizer (BMO) [26] algorithm, aiming to achieve optimally equalized histograms.
Wang et al. [28] introduced a correction method inspired by the illumination reflection model, employing adaptive local gamma transformation and color compensation to enhance image brightness, especially beneficial for low-light images. Acharya et al. [1] proposed an adaptive image enhancement technique using a GA, employing a novel histogram subdivision approach with exposure and optimal thresholds to preserve brightness and minimize information loss.
Khan et al. [17] utilized a metaheuristic algorithm inspired by chimpanzee behavior for contrast enhancement, integrating Bilateral Gamma Correction (BGC) [4] to improve their approach. Motivated by the limitations of the traditional beta function in selecting image enhancement parameters effectively, Braik and Malik [4] introduced a hybrid approach, combining the Whale Optimization Algorithm (WOA) [21] with the Chameleon Swarm Algorithm (CSA) [5, 4] to create the Hybrid Whale Optimization Algorithm (HWOA).
This method adapts parameters of the incomplete beta function for enhanced image quality. Recently, Pérez et al. [22] introduced a method for enhancing image contrast utilizing a hyperbolic tangent sigmoid function. Integrated with DE, GA, and PSO algorithms, this approach aims to enhance pixel intensity in low-contrast images through nature-inspired metaheuristics.
This study introduces a transformation function based on the gamma correction function, specifically tailored for contrast enhancement. The function’s effectiveness is systematically evaluated by integrating it into three prominent bio-inspired metaheuristic algorithms:
GA, DE, and PSO. Experimental results validate the practicality and efficiency of this approach across diverse color images, demonstrating its adaptability and versatility. The successful integration of the proposed dual-gamma correction function into established algorithms highlights its potential for enhancing contrast in real-world image processing tasks.
The paper is organized by Section 2 present the general background to understand the study, Section 3 describes the proposed transformation function. Section 4 present the experimental study conducted to evaluate the proposed transformation function. Section 5 exposes an analysis of results. Finally, Section 6 provides the conclusions and possible paths for future investigations.
2 General Background
2.1 Contrast
The contrast of an image can be defined as the discrepancy between the intensity values of the pixels that compose it. An image with more pronounced contrast exhibits abrupt transitions between its different areas, which is often preferable aesthetically or in terms of comprehension. A high-contrast image tends to stand out and create a dramatic effect, contributing to its visual quality. On the other hand, a low-contrast image tends to be smoother, with minimal variations between its areas. In summary, contrast is closely linked to the ability to perceive details and variations in pixel intensity levels.
2.1.1 Sum Edge Intensity
The Sum of Edge Intensity (SEI) is employed to gauge areas within images exhibiting abrupt transitions between adjacent regions. This involves summing the disparities among neighboring pixels along the detected edges, a process facilitated by edge detection algorithms such as Sobel or Canny. The resulting value signifies the total intensity change along the edges. A higher SEI value indicates greater contrast within the image, leading to enhanced visual perception of its details and features.
2.1.2 Count of Edge Pixels
Through Count of Edge Pixels (CEP), it’s possible to identify and count the pixels that comprise the edges in an image, providing a numerical measure of the number of edges present.
This calculation can be performed using edge detection techniques such as convolution operators (such as Sobel or Roberts), thresholding algorithms, or more advanced methods such as the Canny algorithm. A higher number of edges and intensity transitions in the image result in a higher count of pixel edges. This metric is also used to assess the quality and sharpness of an image.
2.1.3 Entropy of Image
Entropy provides a measure of the informational content in an image to evaluate the distribution of intensity levels present within it.
It describes the degree of uncertainty or randomness in an image. The more information the image contains, the higher its quality will be. The entropy of an enhanced image is defined as:
where,
2.2 Quality Indicators in Digital Images
Certain metrics are essential for assessing the quality of enhanced images. Most of these metrics compare the original image with the processed one based on various parameters detailed in this section.
2.2.1 Peak Signal-to-noise ratio (PSNR) [3]
The PSNR is a quantitative metric used in image enhancement to compare pixel information between two images, and it is defined as:
Such that:
where
2.2.2 Structural Similarity Index Measure (SSIM) [25]
The SSIM is a metric that evaluates image quality by analyzing luminance, contrast, and structure. It measures the resemblance between a reference image and another one, providing insights into perceptual quality and fidelity. The formulation of this metric is described as follows:
Such that:
where
2.2.3 Relative Enhancement Contrast (REC) [13]
The REC is a metric that measures the contrast difference between an original image and its enhanced version. It is calculated as the contrast ratio in the original image to that in the enhanced image. REC provides valuable numerical insight into how the enhancement process alters or intensifies visual distinctions within the image. This metric is calculated as follows:
where
where
3 Proposed Approach
This section presents the proposed transformation function, which relies on a dual-gamma correction function for contrast enhancement, and the fitness function utilized in our experimental study.
3.1 Transformation Function
In specialized literature, several researchers have embraced a common practice involving the use of a transformation function to adjust pixel intensity levels in an original image to enhance its contrast. Various methodologies employing a piecewise linear transformation function have been applied, as evidenced in studies conducted by Russo [24] and Ling et al. [19].
Both approaches allow for the optimization of parameters within the transformation functions to enhance contrast in low-contrast images. The altered pixels may exhibit increased prominence upon applying the transformation function, potentially exceeding the permissible range of intensity levels or even taking on negative values, if applicable.
Addressing this challenge necessitates replacing the piecewise curve with a continuous curve. Gamma correction can be used to improve the visual quality of images by adjusting their brightness and contrast. This nonlinear function involves applying a power-law relationship to the pixel values of an image. Considering images with Λ intensity levels, the gamma correction function is stated as follows:
where
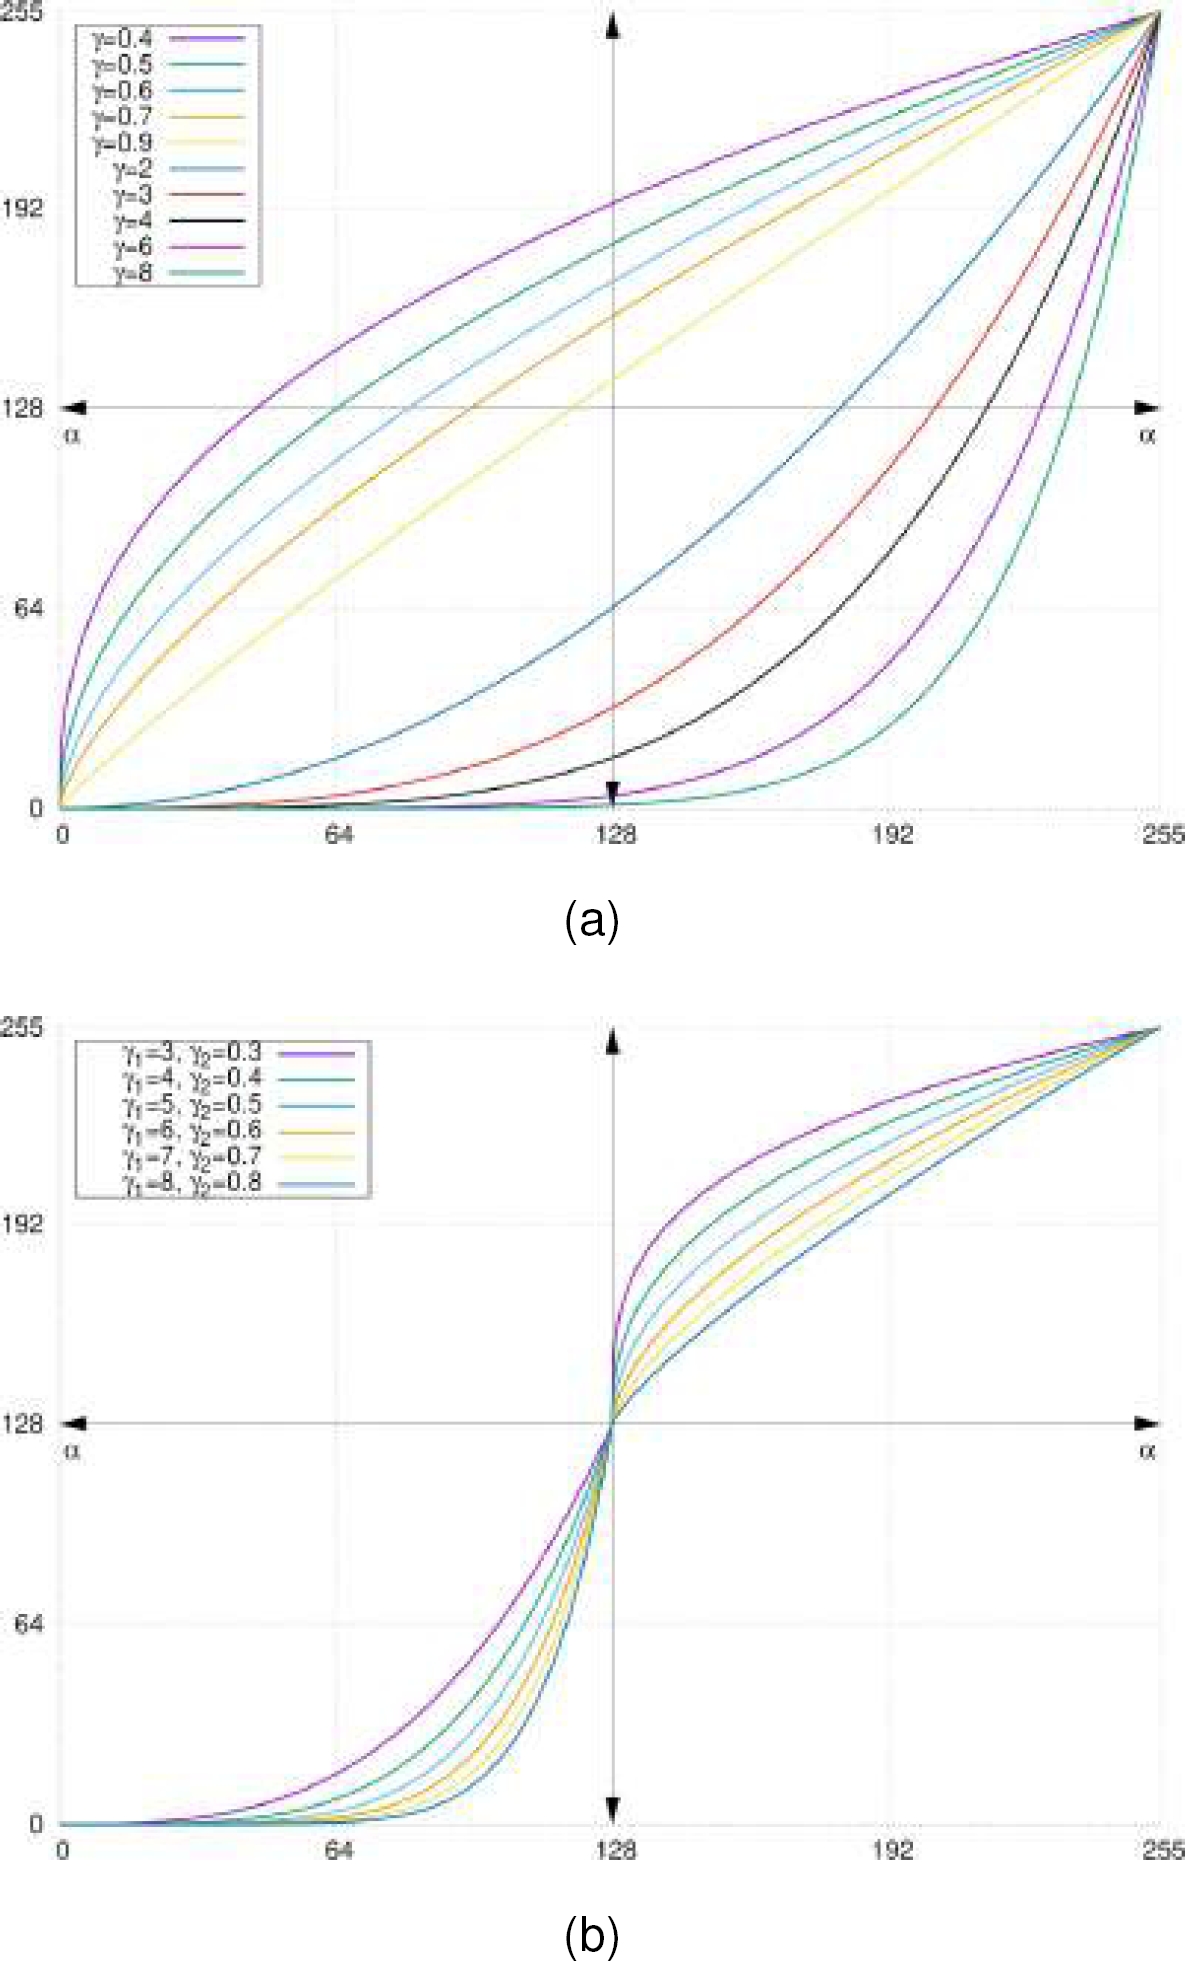
Fig. 1 Different configurations of gamma correction functions: (a) Standard gamma correction function and (b) Dual-gamma correction function
This investigation introduces a transformation function, the dual-gamma correction with adaptive parameters, specifically designed for contrast enhancement. The proposed function is based on the gamma correction function and considers the properties of darkening and lightening images. These two properties are utilized by defining the following dual-gamma correction function:
where
The shape of the dual-gamma correction function is very similar to a sigmoid function, as seen in the transformation functions presented in references [20, 22]. However, a notable advantage of the dual-gamma correction function is its flexibility in controlling the curvature of the concave and convex parts, which do not have to be symmetrical as in a traditional sigmoid function.
3.2 Fitness Function
This section presents the fitness evaluation function used as a strategic measure to assess enhanced image quality. Specialized literature shows that researchers leverage various image-related factors when employing optimization algorithms to gauge the effectiveness of image enhancements. In this study, we have defined the fitness function considering different common aspects of the image, which contribute to the overall evaluation of the enhanced image quality. For a detailed understanding of these indicators, refer to Section 2.2.
Below, we detail the main image-related factors that are integrated into the fitness function:
– Sum Edge Intensity (SEI) Levels of Pixels. This factor includes the sum of the intensity levels of the pixels that are related to the edges.
– Count of Edge Pixels (CEP). This factor measures the number of pixels involved in defining the edges.
– Entropy of Image (EI). In the context of images, entropy serves to assess the amount of overall information or uncertainty present in the distribution of intensity levels.
These meticulously chosen characteristics encompass fundamental aspects of image quality, and their inclusion in the fitness function establishes a comprehensive method for evaluating the effectiveness of image enhancement strategies.
By systematically analyzing these factors, the aim of the proposed methodology is to capture and measure various elements that collectively contribute to the visual fidelity and richness of the enhanced image. These considerations collectively contribute to defining the following fitness function [22]:
where
4 Experimental Study
This section details the experiments conducted and the visual and numerical outcomes obtained by implementing three optimization algorithms: Genetic Algorithm (GA), Differential Evolution (DE), and Particle Swarm Optimizer (PSO), for enhancing image contrast.
-
1. Experimental setup: The study tested the proposed transformation function on color images from the Kodak dataset [7], which have a resolution of 756×512 pixels. Three performance metrics were used to assess the algorithms: Peak Signal-to-Noise Ratio (PSNR), Structural Similarity Index (SSIM), and Relative Enhancement Contrast (REC).
The GA utilized SBX and PBM operators [8], with the
The PSO algorithm used acceleration coefficients
-
2. Performance evaluation: The performance comparison of the three bioinspired algorithms using the dual-gamma function is thoroughly detailed in Table 1.
This table provides a comprehensive overview of each image performance indicator’s average and standard deviation (indicated in parentheses). These indicators are crucial for evaluating the efficiency and effectiveness of the algorithms. The results presented in the table are derived from 30 independent runs for each algorithm on the images from the Kodak dataset.
This extensive testing ensures a robust and reliable assessment of each algorithm’s performance. By analyzing both the average performance and the variability (as indicated by the standard deviation), we gain valuable insights into how well each algorithm performs on average and how consistent their performance is across different runs.
Table 1 Results of the PSNR, SSIM, and REC metrics obtained by applying the GA, DE, and PSO algorithms. The best results for each image for each metric are in bold
| Image | GA | DE | PSO | ||||||
| PSNR | SSIM | REC | PSNR | SSIM | REC | PSNR | SSIM | REC | |
| Kd1 | 16.8572 (0.1905) | 0.7163 (0.0117) | 0.9992 (0.0027) | 16.8764 (0.1004) | 0.7170 (0.0079) | 0.9978 (0.0013) | 16.8816 (0.1542) | 0.7183 (0.0098) | 0.9995 (0.0021) |
| Kd2 | 18.8682 (0.1568) | 0.5431 (0.0150) | 1.2961 (0.0153) | 18.8755 (0.0199) | 0.5433 (0.0009) | 1.2959 (0.0002) | 18.9142 (0.1610) | 0.5490 (0.0199) | 1.2893 (0.0216) |
| Kd3 | 17.1827 (0.3300) | 0.7527 (0.0101) | 0.9779 (0.0020) | 17.1719 (0.1316) | 0.7579 (0.0097) | 0.9800 (0.0018) | 17.1709 (0.2997) | 0.7534 (0.0104) | 0.9787 (0.0027) |
| Kd4 | 17.1640 (0.6314) | 0.6294 (0.0410) | 1.0382 (0.0118) | 17.1949 (0.6740) | 0.6347 (0.0431) | 1.0355 (0.0109) | 16.9465 (0.7188) | 0.6160 (0.0472) | 1.0421 (0.0131) |
| Kd5 | 17.8152 (0.2043) | 0.8332 (0.0068) | 0.9643 (0.0011) | 17.9333 (0.0195) | 0.8392 (0.0024) | 0.9640 (0.0004) | 17.8614 (0.1361) | 0.8330 (0.0032) | 0.9649 (0.0009) |
| Kd6 | 21.0320 (0.4501) | 0.8409 (0.0125) | 1.0220 (0.0015) | 20.8272 (0.4662) | 0.8353 (0.0131) | 1.0227 (0.0015) | 20.9671 (0.0337) | 0.8387 (0.0019) | 1.0228 (0.0001) |
| Kd7 | 16.4192 (0.2633) | 0.7374 (0.0094) | 1.0057 (0.0028) | 16.4762 (0.2519) | 0.7402 (0.0095) | 1.0056 (0.0020) | 16.4901 (0.2377) | 0.7434 (0.0116) | 1.0046 (0.0026) |
| Kd8 | 21.3445 (0.5724) | 0.8923 (0.0082) | 0.9870 (0.0017) | 21.8180 (0.5349) | 0.8993 (0.0066) | 0.9884 (0.0018) | 21.1042 (0.2993) | 0.8882 (0.0035) | 0.9865 (0.0011) |
| Kd9 | 17.3415 (0.1500) | 0.7664 (0.0058) | 1.0153 (0.0051) | 17.3000 (0.0911) | 0.7647 (0.0031) | 1.0158 (0.0051) | 17.3156 (0.1731) | 0.7648 (0.0061) | 1.0159 (0.0048) |
| Kd10 | 17.4971 (0.3275) | 0.7749 (0.0139) | 1.0065 (0.0031) | 17.3092 (0.2557) | 0.7679 (0.0111) | 1.0072 (0.0026) | 17.4651 (0.3551) | 0.7744 (0.0147) | 1.0066 (0.0027) |
| Kd11 | 16.8146 (0.1360) | 0.8106 (0.0045) | 0.9645 (0.0008) | 16.8827 (0.0762) | 0.8121 (0.0013) | 0.9648 (0.0005) | 16.8046 (0.0565) | 0.8159 (0.0029) | 0.9621 (0.0014) |
| Kd12 | 17.5359 (0.1528) | 0.7720 (0.0054) | 1.0193 (0.0007) | 17.2299 (0.2548) | 0.7605 (0.0094) | 1.0206 (0.0012) | 17.0592 (0.3415) | 0.7543 (0.0125) | 1.0219 (0.0017) |
| Kd13 | 18.4690 (0.2950) | 0.8041 (0.0059) | 0.9823 (0.0017) | 18.2290 (0.1151) | 0.7992 (0.0016) | 0.9812 (0.0007) | 18.7616 (0.0000) | 0.8109 (0.0000) | 0.9836 (0.0000) |
| Kd14 | 16.9455 (0.4362) | 0.8447 (0.0100) | 0.9604 (0.0022) | 16.9697 (0.3566) | 0.8451 (0.0063) | 0.9605 (0.0026) | 16.7480 (0.3698) | 0.8417 (0.0080) | 0.9584 (0.0027) |
| Kd15 | 36.2734 (3.5692) | 0.9816 (0.0140) | 1.0059 (0.0025) | 33.8334 (1.7601) | 0.9763 (0.0069) | 1.0075 (0.0013) | 32.8756 (1.6239) | 0.9682 (0.0067) | 1.0082 (0.0012) |
| Kd16 | 19.0342 (0.4507) | 0.8749 (0.0101) | 0.9842 (0.0025) | 19.1408 (0.1485) | 0.8820 (0.0057) | 0.9830 (0.0013) | 19.0946 (0.3325) | 0.8737 (0.0095) | 0.9852 (0.0025) |
| Kd17 | 20.2732 (0.3743) | 0.9273 (0.0043) | 0.9646 (0.0015) | 20.0042 (0.3447) | 0.9244 (0.0040) | 0.9636 (0.0013) | 20.8274 (0.0000) | 0.9364 (0.0000) | 0.9656 (0.0000) |
| Kd18 | 17.0024 (0.1752) | 0.7783 (0.0039) | 0.9818 (0.0009) | 16.9565 (0.1747) | 0.7773 (0.0039) | 0.9815 (0.0009) | 16.9955 (0.1607) | 0.7778 (0.0033) | 0.9819 (0.0009) |
| Kd19 | 18.5745 (0.2793) | 0.7903 (0.0057) | 0.9983 (0.0016) | 18.7050 (0.0026) | 0.7915 (0.0001) | 0.9992 (0.0000) | 18.4790 (0.2820) | 0.7884 (0.0071) | 0.9980 (0.0013) |
| Kd20 | 31.2692 (0.5440) | 0.9663 (0.0042) | 1.0037 (0.0002) | 31.2247 (0.2119) | 0.9665 (0.0020) | 1.0037 (0.0001) | 31.2197 (3.8982) | 0.9614 (0.0073) | 1.0040 (0.0007) |
| Kd21 | 17.5537 (0.6488) | 0.8136 (0.0162) | 0.9951 (0.0081) | 17.2701 (0.0084) | 0.8205 (0.0005) | 0.9914 (0.0001) | 18.0753 (0.9235) | 0.8089 (0.0191) | 0.9998 (0.0101) |
| Kd22 | 18.4110 (0.3396) | 0.7488 (0.0188) | 1.0102 (0.0022) | 18.2402 (0.2036) | 0.7405 (0.0115) | 1.0110 (0.0013) | 18.4090 (0.1609) | 0.7493 (0.0098) | 1.0101 (0.0018) |
| Kd23 | 18.5391 (0.3745) | 0.7628 (0.0157) | 1.0045 (0.0029) | 18.9329 (0.1260) | 0.7769 (0.0019) | 1.0055 (0.0007) | 18.5644 (0.3896) | 0.7596 (0.0258) | 1.0050 (0.0035) |
| Kd24 | 17.5558 (0.2629) | 0.7858 (0.0071) | 0.9824 (0.0020) | 17.5020 (0.2662) | 0.7828 (0.0080) | 0.9827 (0.0015) | 17.2672 (0.2639) | 0.7814 (0.0094) | 0.9785 (0.0024) |
This detailed comparison helps in understanding the strengths and potential limitations of each bioinspired algorithm when applied to image contrast enhancement using the dual-gamma correction function.
5 Analysis of Results
This section analyzes the results from the three metaheuristics by comparing three performance indicators that evaluate the quality of image enhancement. The adopted metaheuristics aim to improve image-related factors attributed to high contrast by optimizing Eq. (10). The performance indicators PSNR, SSIM, and REC are employed in order to ensure that the transformation function, i.e., the dual-gamma correction, preserves the main features of the original images.
In this regard, Table 1 shows the performance indicator values obtained by the algorithms. The best average values for each image are highlighted in bold, with standard deviation values provided in parentheses. Additionally, a performance analysis for each indicator is conducted. For each performance indicator, the algorithm achieving the best average value for each image is highlighted in bold. The visual results of the three contrast enhancement methods are shown in Fig. 2.
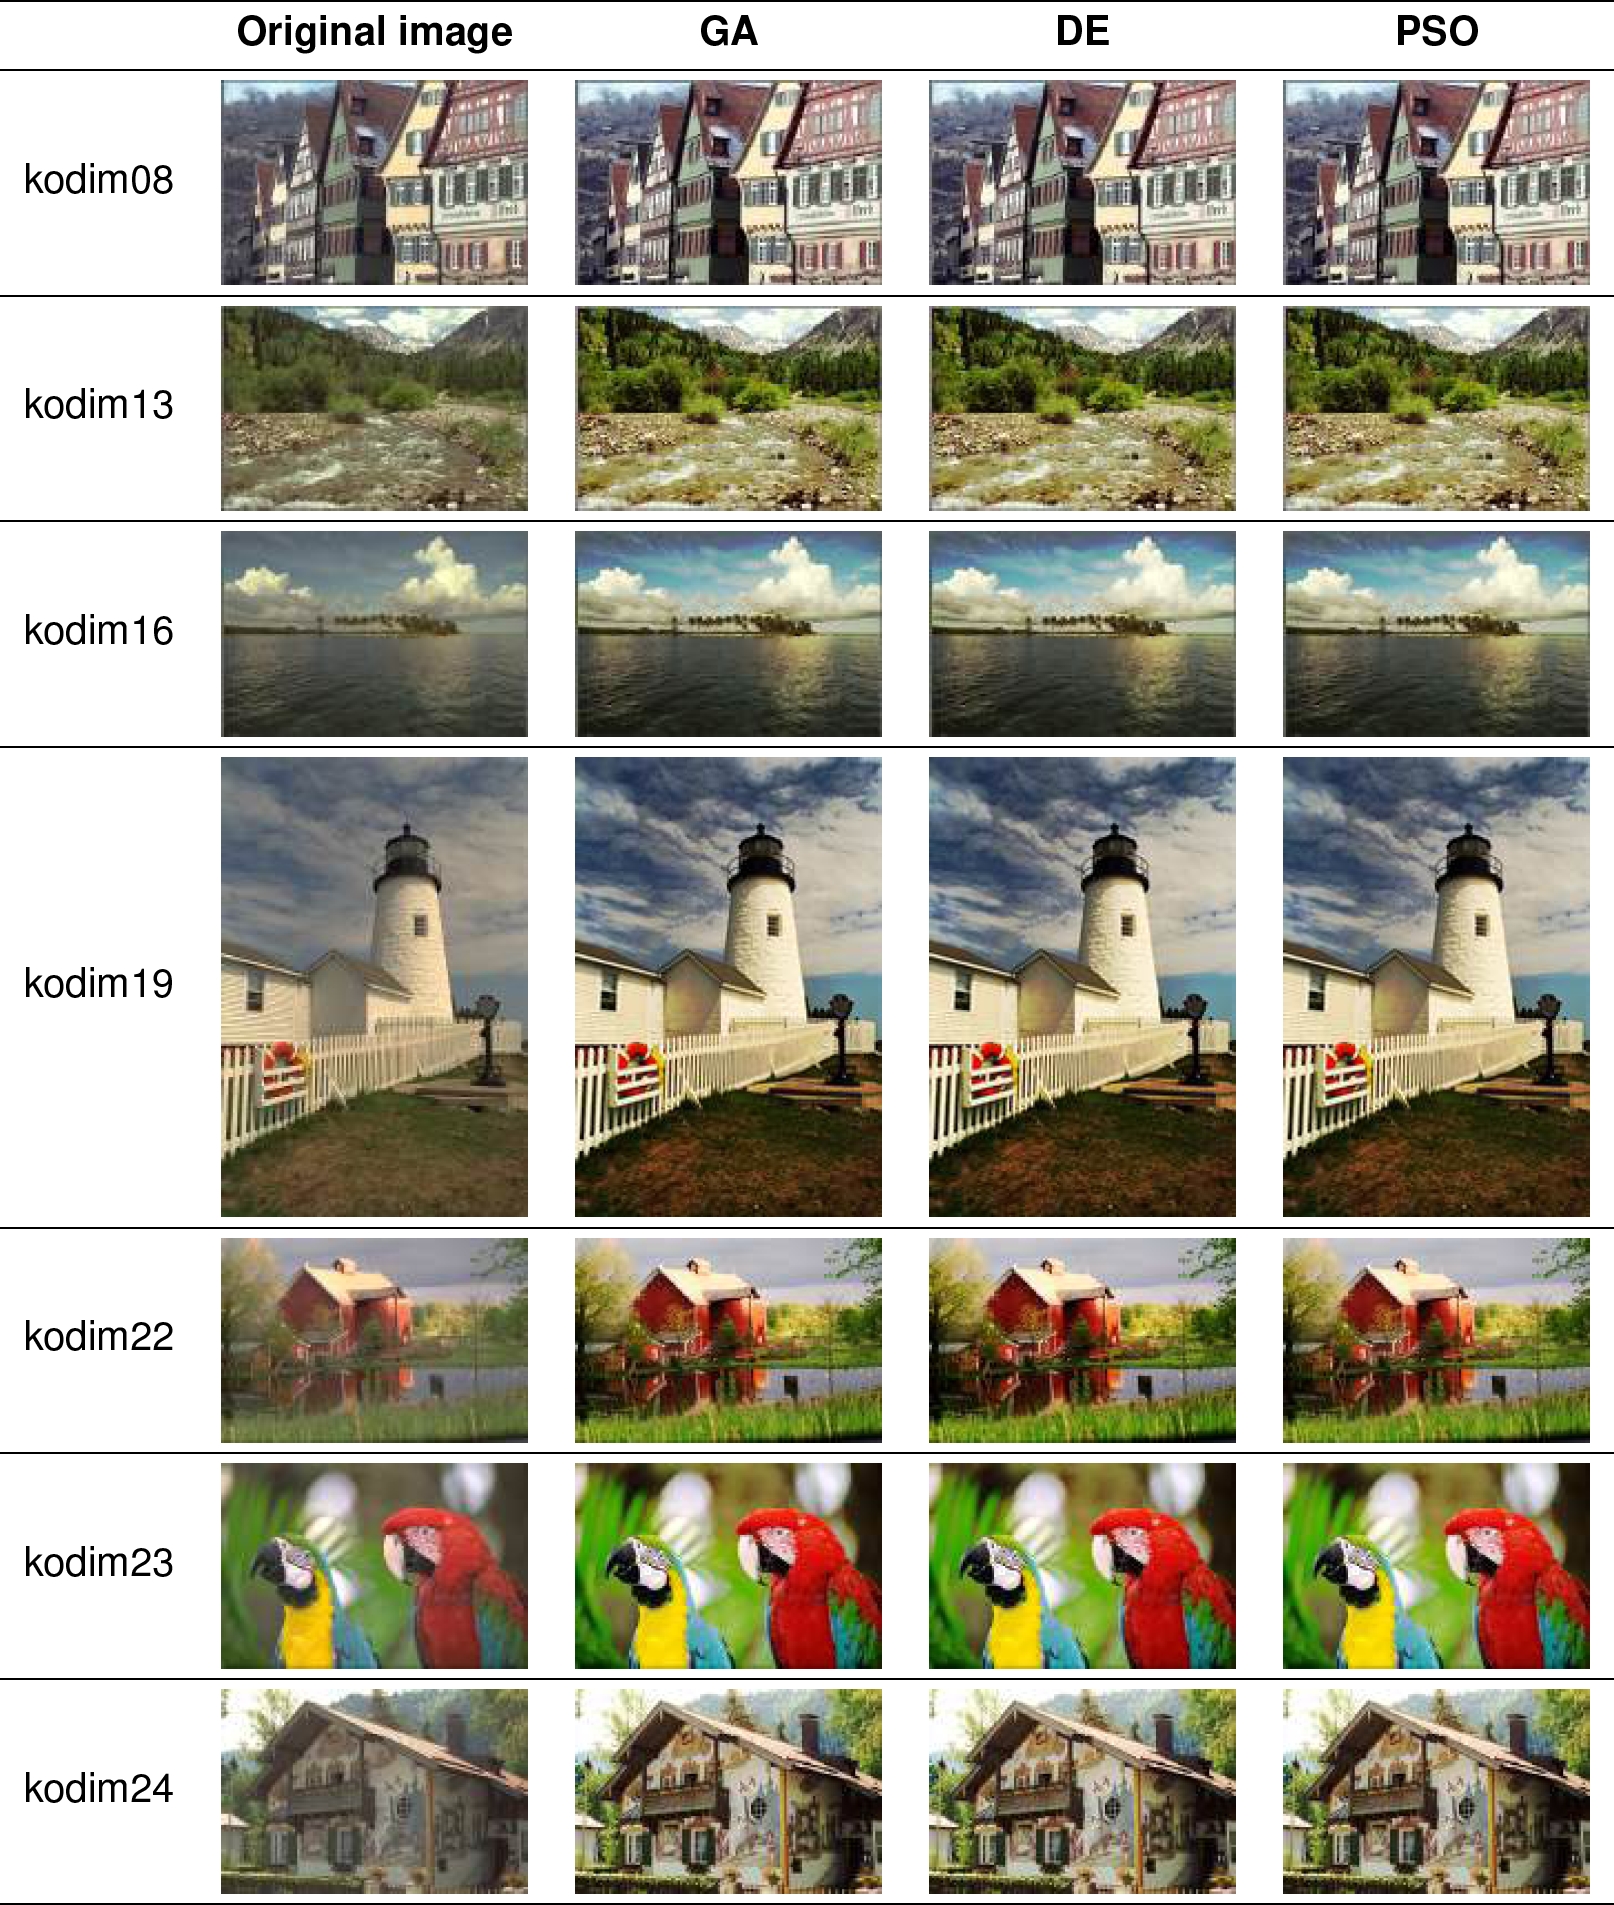
Fig. 2 Comparison of reference and enhanced images obtained by applying the optimization algorithms: GA, DE, and PSO to the images kodim08, kodim13, kodim16, kodim19, kodim22, kodim23, and kodim24
From Fig. 2, it can be observed that the algorithms significantly improve the contrast and illumination of the original images, demonstrating the excellent performance of the proposed gamma function combined with the three metaheuristics used: GA, DE, and PSO algorithms. The following sections provide a comprehensive discussion of the noteworthy results obtained from the experimentation.
5.1 Peak Signal-to-noise Ratio
Table 1 displays the PSNR values obtained for each image after applying the contrast enhancement. The data indicate that the GA algorithm achieved higher efficiency in enhancing contrast for most images from the Kodak dataset compared to the DE and PSO algorithms. Fig. 2 visually presents the contrast enhancement results for the images.
The figure illustrates significant differences in the contrast improvements achieved by each algorithm. By comparing the enhanced images with the original reference images, one can more clearly appreciate the effectiveness of the contrast enhancement and the benefits of the proposed dual-gamma correction function. This visual comparison highlights how each algorithm modifies the contrast and maintains the image quality.
5.2 Structural Similarity Index Measure
The results of the SSIM indicator for the DE, GA, and PSO algorithms are presented in Table 1. The data reflect the satisfactory performance of each algorithm in terms of contrast enhancement, with most images showing SSIM values above 0.70. This suggests a high structural similarity with the original images.
Additionally, the visual effects of contrast enhancement according to this indicator are illustrated in Fig. 2. In this figure, the original images are compared with those enhanced by each algorithm, allowing for a clear visual comparison of their effectiveness. The enhanced images demonstrate significant improvements in contrast while maintaining the structural integrity of the originals.
5.3 Relative Enhancement
The REC indicator shows values ranging from 0.9584 to 1.2961 for each algorithm, indicating a positive improvement in the overall contrast of the images with the GA, DE, and PSO algorithms. A closer look at the data in Table 1 reveals that the PSO algorithm outperforms both the GA and DE algorithms. Specifically, PSO demonstrates a more noticeable enhancement in contrast across a greater number of images.
Additionally, Fig. 2 provides a visual comparison of the original images and the results achieved by each algorithm. The figure clearly illustrates the significant differences between the original and enhanced images, highlighting the effectiveness of each algorithm in improving contrast. This visual evidence underscores the improvements made by the PSO algorithm in contrast enhancement.
6 Conclusion and Future Work
This study introduced a novel approach to improve image contrast by combining the gamma correction function with the GA, DE, and PSO algorithms. This proposal focuses on enhancing the intensity levels of pixels in low-contrast images. By using bioinspired metaheuristics, the parameters of the proposed dual-gamma correction function are optimized, improving image contrast. The dual-gamma correction function was initially employed by three metaheuristics.
However, its potential can extend to include other evolutionary approaches. The experimental results demonstrated the effectiveness of the dual-gamma correction function in enhancing the contrast of low-clarity images. Notably, no single algorithm outperformed the others in all performance indicators.
Future research in this area is extensive and poses several challenges that require further investigation and experimentation. It is essential to explore powerful bio-inspired metaheuristics that can effectively address the issue of local optima, which is currently influenced by image luminosity characteristics.
Additionally, an exhaustive examination of quality indicators is necessary to quantify image contrast accurately. By doing so, new objective functions can be developed to guide the behavior of metaheuristics, leading to improved results in terms of image contrast. Furthermore, designing new transformation functions for contrast enhancement that offer greater flexibility and freedom in transforming images are also needed.

