


 nueva página del texto (beta)
 Inglés (pdf)
 Artículo en XML
 Referencias del artículo
 Enviar artículo por email
 Citado por SciELO
  Similares en
SciELO
Similares en
SciELO 
 Permalink
1 Introduction
Cardiac arrhythmias (CAs) are irregularities in the heart’s contraction and relaxation cycles. Among the most common types are Atrial Fibrillation (AF), Ventricular Fibrillation (VF), Atrial Flutter (AFL), Paroxysmal Supraventricular Tachycardias (PSVT), and Atrioventricular Block (AB). According to the World Health Organization (WHO), CAs are a leading cause of death worldwide, with a prevalence affecting approximately 3% of the global population [13].
The automatic classification of cardiac arrhythmias has garnered significant interest due to the severity of this condition. In the field of machine learning, detection techniques have been developed to support specialists.
These techniques are based on convolutional neural networks (CNN) [15], recurrent neural networks (RNN) [16], and support vector machines (SVM) [8], among others. Hybrid architectures combining these algorithms have also been employed to enhance model performance [1].
However, these models require large amounts of data and numerous hidden layers to extract and analyze features, leading to significant processing time and computational cost. This issue becomes problematic for real-world applications that necessitate dedicated components like GPUs to achieve satisfactory results [11]. Training these models is time-consuming and computationally expensive, limiting their implementation in embedded systems.
Additionally, preprocessing of the signals is crucial for training these models, requiring the transformation of raw signals into a domain where more significant features can be extracted and analyzed [12]. State-of-the-art preprocessing techniques include the application of signal filters to emphasize specific features and remove noise [2], time-frequency feature extraction to compress signals while preserving important features [16], and dimensionality reduction techniques like principal components analysis (PCA) [9].
The choice of technique varies depending on the approach. In this study, ECG signals were transformed into the spectral domain, as spectral representations provide more significant information than other domains, thus improving model processing effectiveness [17].
This study presents an architecture based on a deep autoencoder trained with normalized and preprocessed ECG signals using different spectral representations. The proposed architecture offers lower computational cost and better results than state-of-the-art architectures due to:
Fewer hidden layers, resulting in reduced processing time.
No need for large amounts of data.
Compatibility with less powerful hardware.
Applicability to other types of signals.
This paper is organized as follows: Section 2 explains preprocessing techniques and provides a brief description of the autoencoder architecture. Section 3 describes the proposed method and hyperparameter tuning. Section 4 presents experimental results and a comparative analysis with state-of-the-art techniques. Finally, Section 5 provides conclusions and suggestions for future work.
2 Background
This section provides a general overview of the fundamental techniques, data, and concepts used in the analysis and processing of ECG signals. It covers the database used in this work and various signal analysis methods, including the application of different spectral estimation techniques. Additionally, a brief description of the model used for ECG classification is provided.
2.1 Data
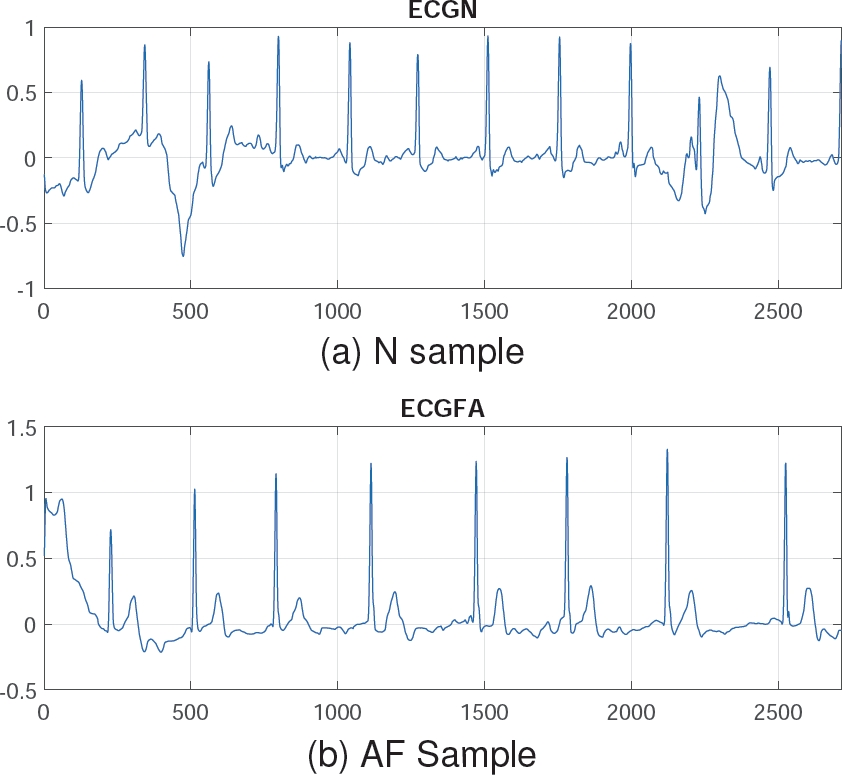
To evaluate the proposed model, the PhysioNet CinC 2017 database was used, containing ECG lead II samples of normal rhythms (N) and atrial fibrillation (AF) recorded at 300 Hz. The database includes 5050 instances for class N and 738 instances for class AF, with samples of varying lengths. To avoid class imbalance and preserve the maximum number of instances, the length of all signals was reduced to 2714 samples, which is the minimum length in the dataset.
The N class was reduced to 738 instances to match the AF class, instead of using any data augmentation techniques [5], thereby preserving the signals from the original database. This preprocessing step resulted in 738 instances per class, each with a length of 2714 samples. Figure 1 shows a sample of Normal Rhythm (N) and Atrial Fibrillation (AF). Note that the N class has an amplitude up to 1, whereas class AF exceeds this value. These signals can be analyzed and processed using signal analysis techniques for better representation.
2.2 Signal Analysis
Signals are entities that convey information and can propagate through a medium, whether material or vacuum.
The objective of signal analysis is to characterize a signal and interpret data in different domains such as time and frequency. Depending on the purpose and properties of the signal, one domain may be preferable over another.
Among the methods used in signal analysis are time-frequency methods, discrete wavelet transform, and spectral estimation. The spectral domain, in particular, offers an excellent representation of signals, providing more discriminating features [17].
2.3 Spectral Analysis
Spectral analysis is a signal processing method aimed at representing the dynamic patterns of signals in the frequency domain. It offers a complementary perspective to the time domain, often providing more useful information for the characterization of biomedical signals [14]. This study utilizes spectral representations that are prevalent in the literature, including:
2.3.1 AR Burg Spectrum
This method is based on forward and backward prediction errors and on direct estimation of the reflection coefficients [14]. Assuming we have data measurements
The autoregressive parameters are calculated by:
The Burg method reflects the recursive-in-order estimation of
The prediction errors in equations 1 and 2 satisfy the following recursive-in-order expressions:
Finally, from 5 and 6, the power spectral density (PSD) estimation is formed by:
where
2.3.2 Covariance Spectrum
The covariance spectrum is a representation used in signal analysis, including electrocardiogram (ECG) signals. It is based on estimating the signal’s autocovariance function, which describes how signal values at different time points are related [6]. For any complex time series, a similar estimator can be found by minimizing the estimate of the prediction error power by:
The complex gradient can affect the minimization of 8 to achieve the AR parameter estimates as the solution of the equations:
where:
From 9, the AR parameters estimates are calculated by:
The white noise variance is estimated as:
And then, from 11 and 12 the PSD can be estimated by:
2.3.3 Yule-Walker Spectrum
This method is also called autocorrelation method, fits an autoregressive model to the windowed input data by minimizing the forward prediction error in the least squares sense [18]:
All the values of the
the equation with respect to the real and imaginary parts of
The matrix representation is defined by:
where:
where
Then, the white noise variance
And the final result is obtained by using 14:
Finally, from 19 and 20, the PSD is estimated by:
2.3.4 Fast Fourier Transform Spectrum
Fast Fourier Transform is a very efficient algorithm in computing Discrete fourier transform (DFT) coefficients and can reduce a very large amount of computational complexity evaluating the DFT series [18]. The expression for the DFT is:
where
From a computational point of view,
Since
2.3.5 Periodogram Spectrum
The periodogram was introduced in searching for hidden periodicities while studying sunspot data, it is called a direct method because it directly uses the time series to estimate the PSD , it provides the critical link between quantities that you can measure directly from the finite-length signal and those that you cánt [10]. The original estimates of PSD
where
Since the energy of an analogue signal
Taking into account Parseval’s theorem, we can assume the following:
where
2.3.6 Welch Spectrum
When it is necessary to average a periodogram, a popular technique for this is the Welch’s method. This method is based on the same idea as Barlett’s approach of spliting the data into segments. Welch method is basically a refinement of the Bartlett method in two respects. First, the data segments in the Welch method are allowed to overlap.
Second, each data segment is windowed prior to computing the periodogram. This method uses a sequence of random data
where
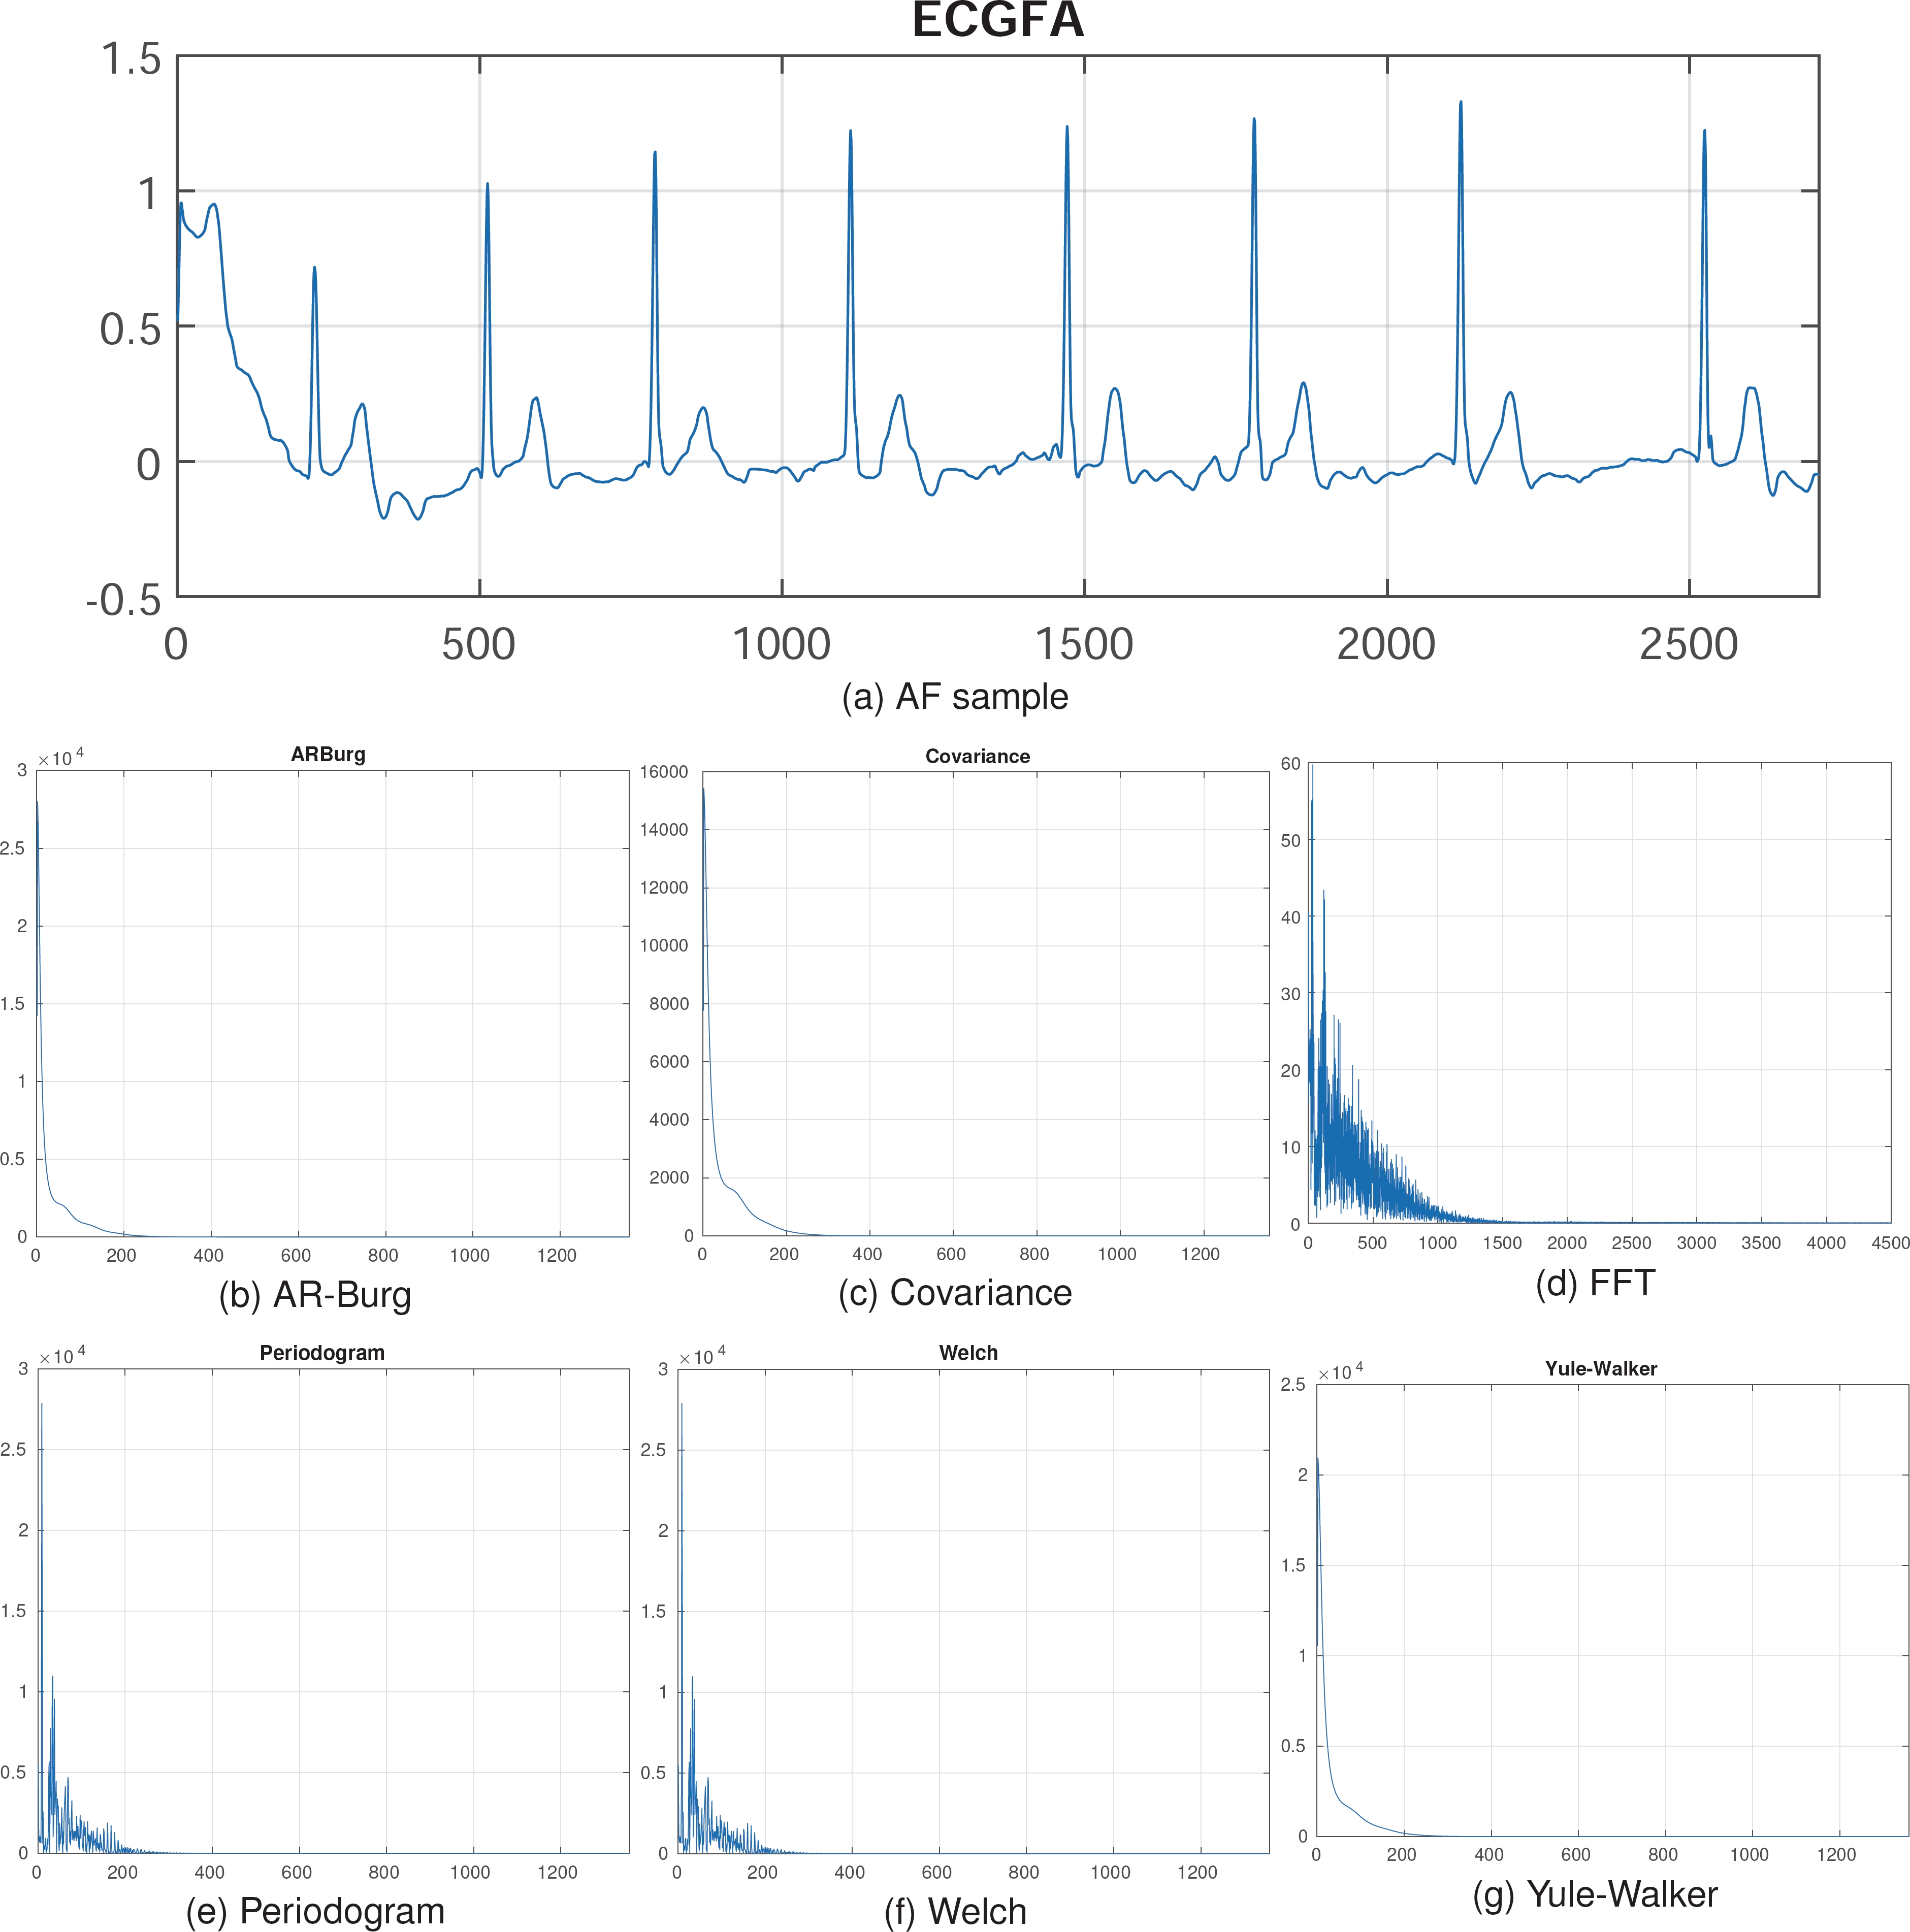
As seen in Figure 2, preprocessing reduces the signal dimension from 2714 to 1358, corresponding to the frequency and features of the original signal. These spectral representations can then be used to train deep learning models for improved results.
2.4 Autoencoder
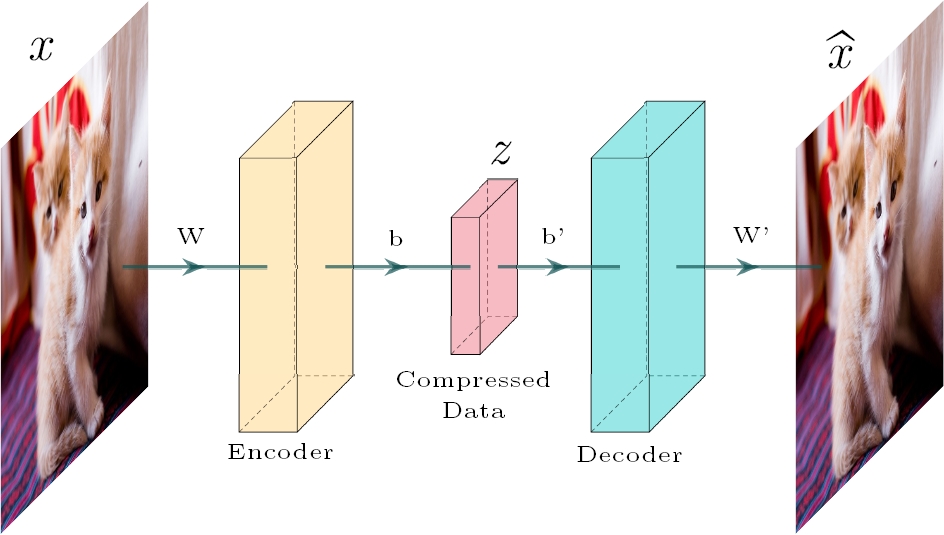
Autoencoders are a feedforward and non-recurrent neural network which is unsupervised learning, meaning it can learn from itself. The objective of Autoencoders is to reduce the dimension and minimize the differences between the encoded and decoded data [4]. The process of encoding and decoding is shown in Figure 3. From a mathematical point of view, the autoencoding is formalized as:
where z is de encoded data,
In addition to this theory, the base architecture of an Autoencoder can be modified depending on the task to be performed, other models can be stacked on their central layer to take advantage of the encoder’s feature extraction.
3 Proposed Scheme
This section outlines the deep autoencoder architecture and the hyperparameter tuning used to optimize the model’s performance. The proposed method for the classification of atrial fibrillation is divided into two sections: the encoding process and the classification process. The proposed architecture is illustrated in Figure 4.
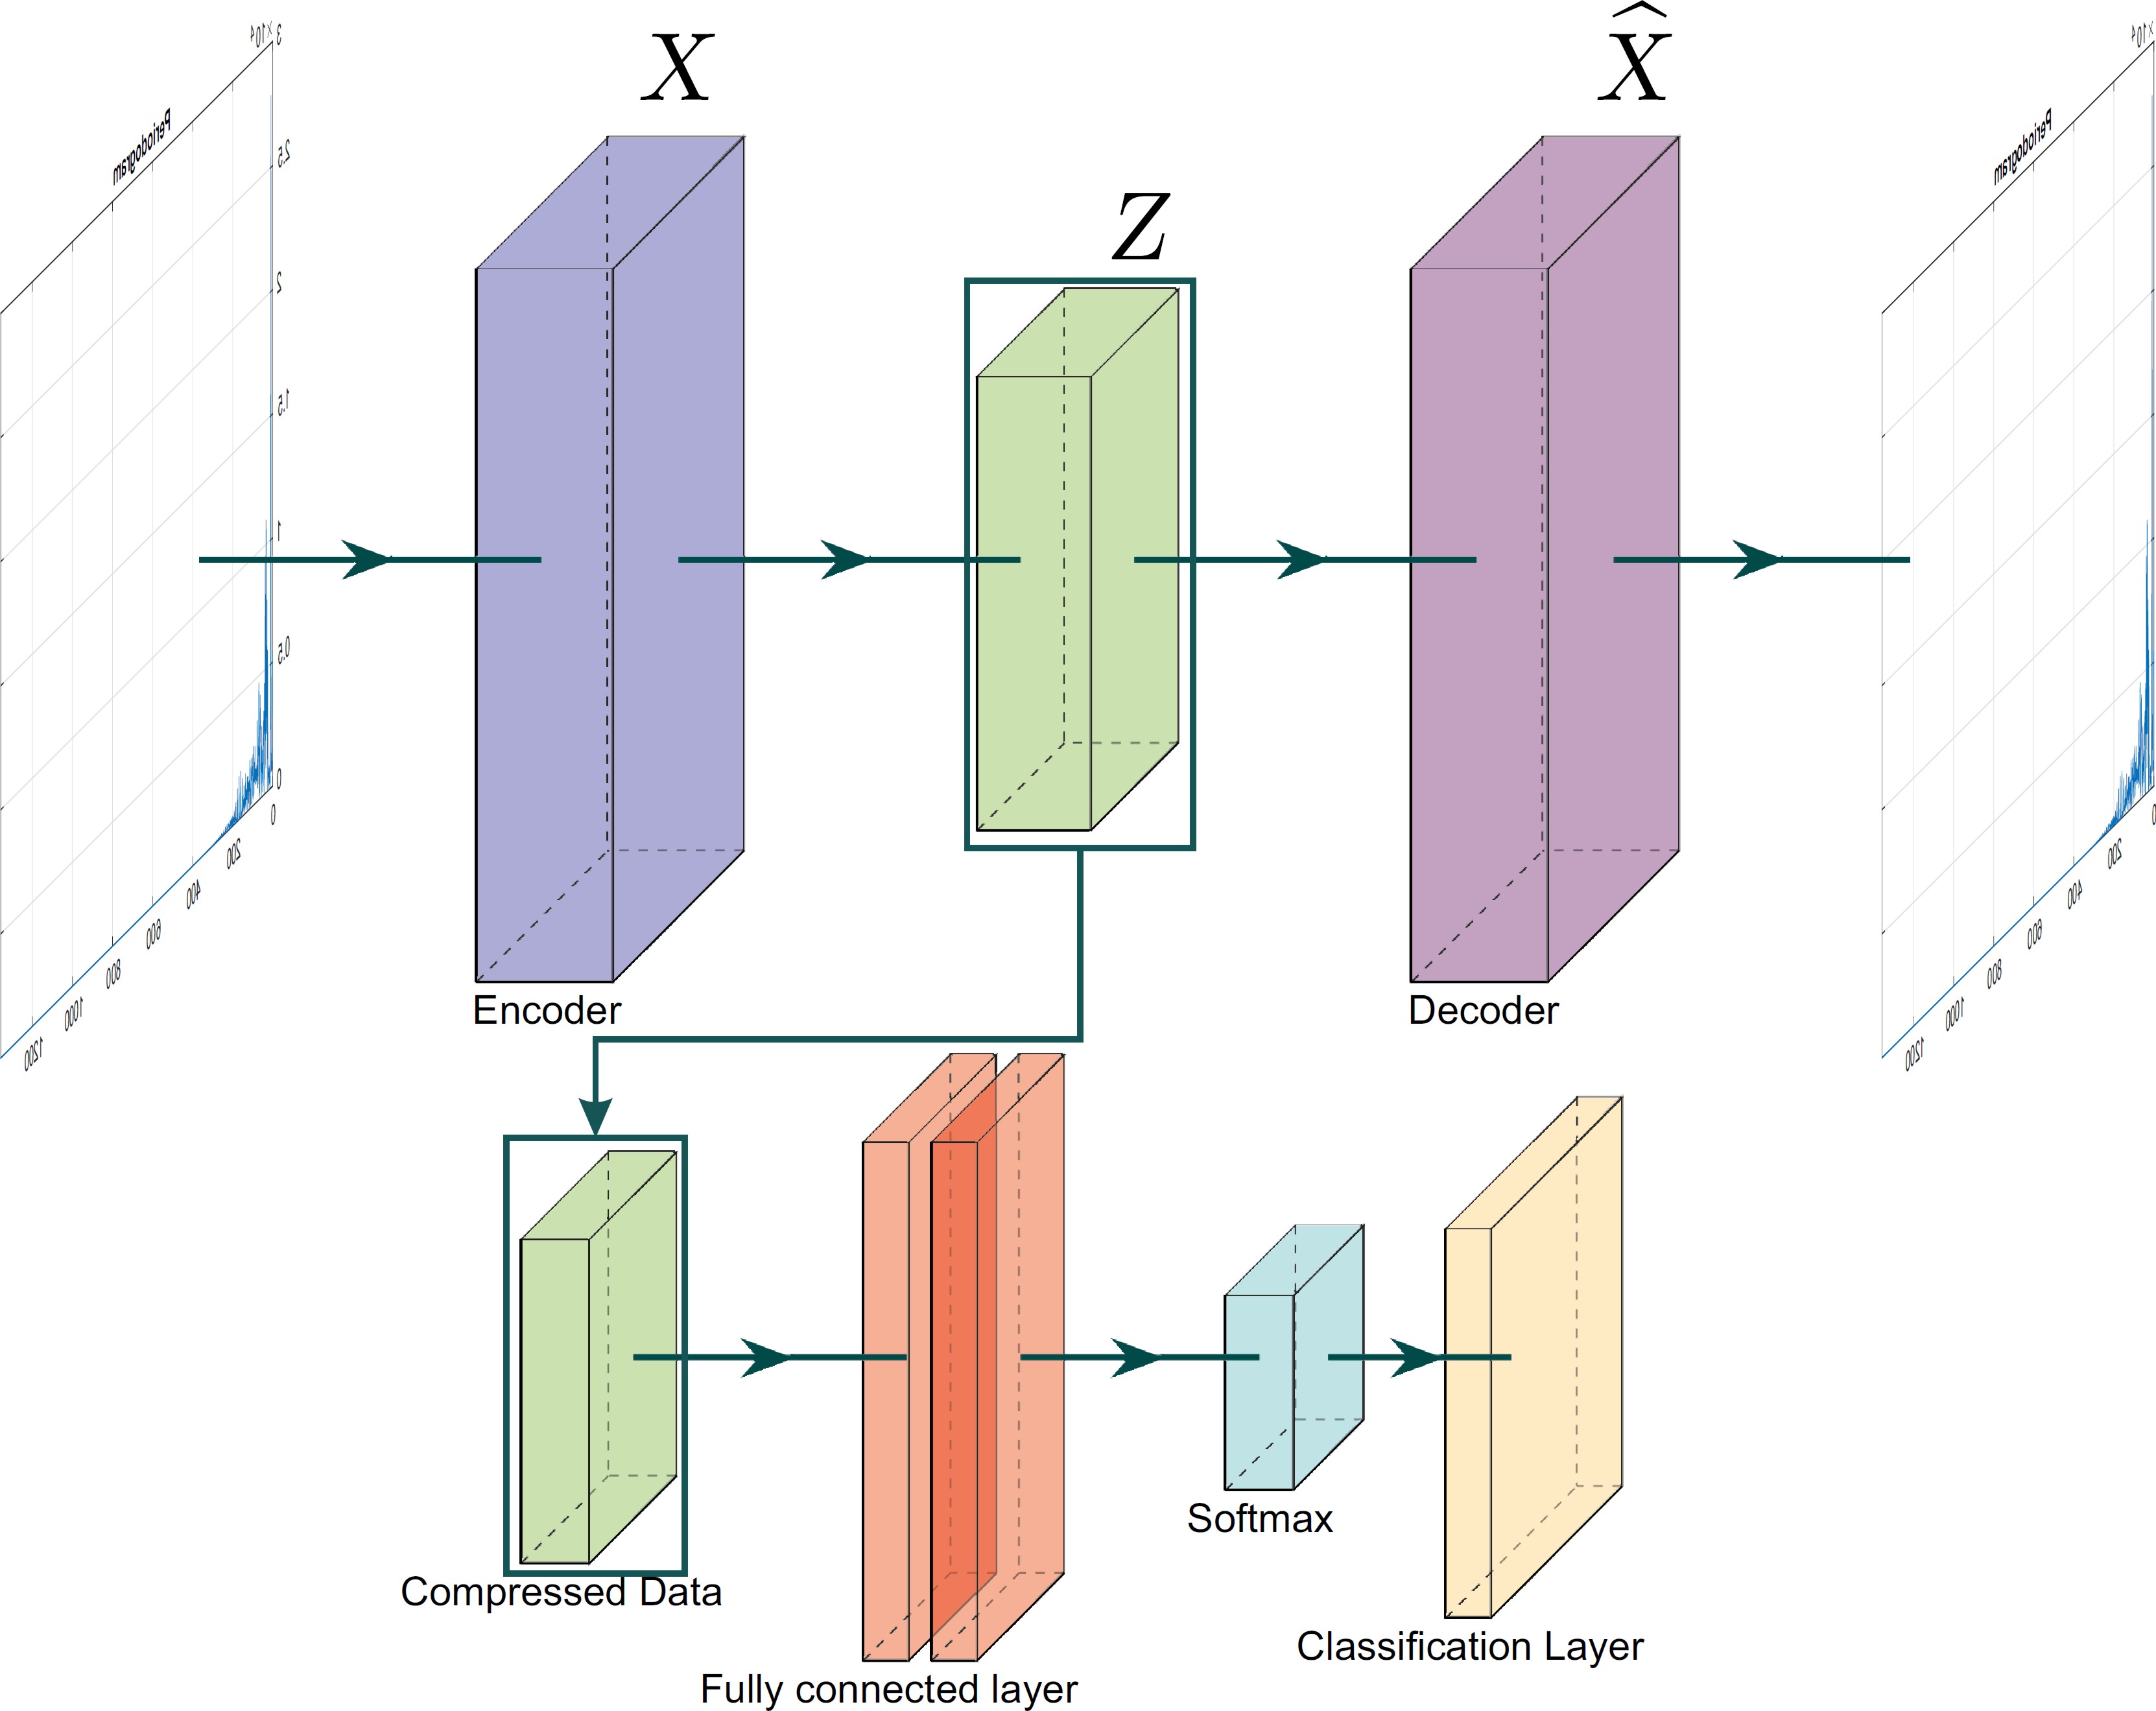
3.1 Encoding
This part corresponds to the basic process of the autoencoder and to the first part of the proposed methodology. In this section, the autoencoder is trained, and the input signals are encoded in an abstract representation, extracting features and reducing dimensionality.
3.2 Classification
Once the autoencoder is trained and the signals are encoded, the abstract representations are used to feed the classification model. This model consists of training a simple fully connected layer, which analyzes the features and makes the classification through a softmax activation function.
3.3 Hyperparameters Tuning
Hyperparameter tuning plays a crucial role in optimizing the performance of the proposed model for ECG classification [3]. This process includes the careful selection of the learning rate, the number of training epochs, the mini-batch size, and L2 weight regularization.
These parameters are fine-tuned to find the optimal balance between model accuracy and training time, ensuring that the model neither overfits nor underfits the training data. Extensive experimentation was conducted with different hyperparameter configurations to achieve the best test accuracy. From the above, the best tuning for classifying ECG classes using the autoencoder is as follows:
Encoding and decoding layer with 1358 neurons, corresponding to the input length of 1358 samples, this is represented as:
Due to the nature of the autoencoder, the features extracted in the encoding layer are used to reconstruct the signal. However, this reconstruction process is not directly relevant to the classification task, as the classification occurs in the central layer.
For the classification model with a softmax function, the following hyperparameters were selected: learning rate of 0.01, minibatch of 256, L2 weight regularization of 0.001 and 200 epochs for training. To infer the classes and perform the classification, a softmax function was used.
For binary classification, the output of the softmax function is defined as [7]:
where
4 Experimental Results
4.1 Proposed Model
Once preprocessing was completed, the spectral representations of the signals were obtained. Due to the limited size of the dataset, a cross-validation approach was employed, dividing the dataset into 10 folds to ensure variability and an 90/10 split between training and testing data.
A training session was conducted for each of the six spectra obtained to compare results. All trainings were performed using MATLAB 2023b, and the results were validated using standard metrics from the literature, including Accuracy, Recall, Specificity, Precision, F1 score, Matthews Correlation Coefficient, Kappa, and processing and inference time.
Figure 5 shows statistical results of cross validation for all spectral representations. The results indicate that the Welch and Periodogram methods are the most effective and consistent for atrial fibrillation classification using a deep autoencoder.
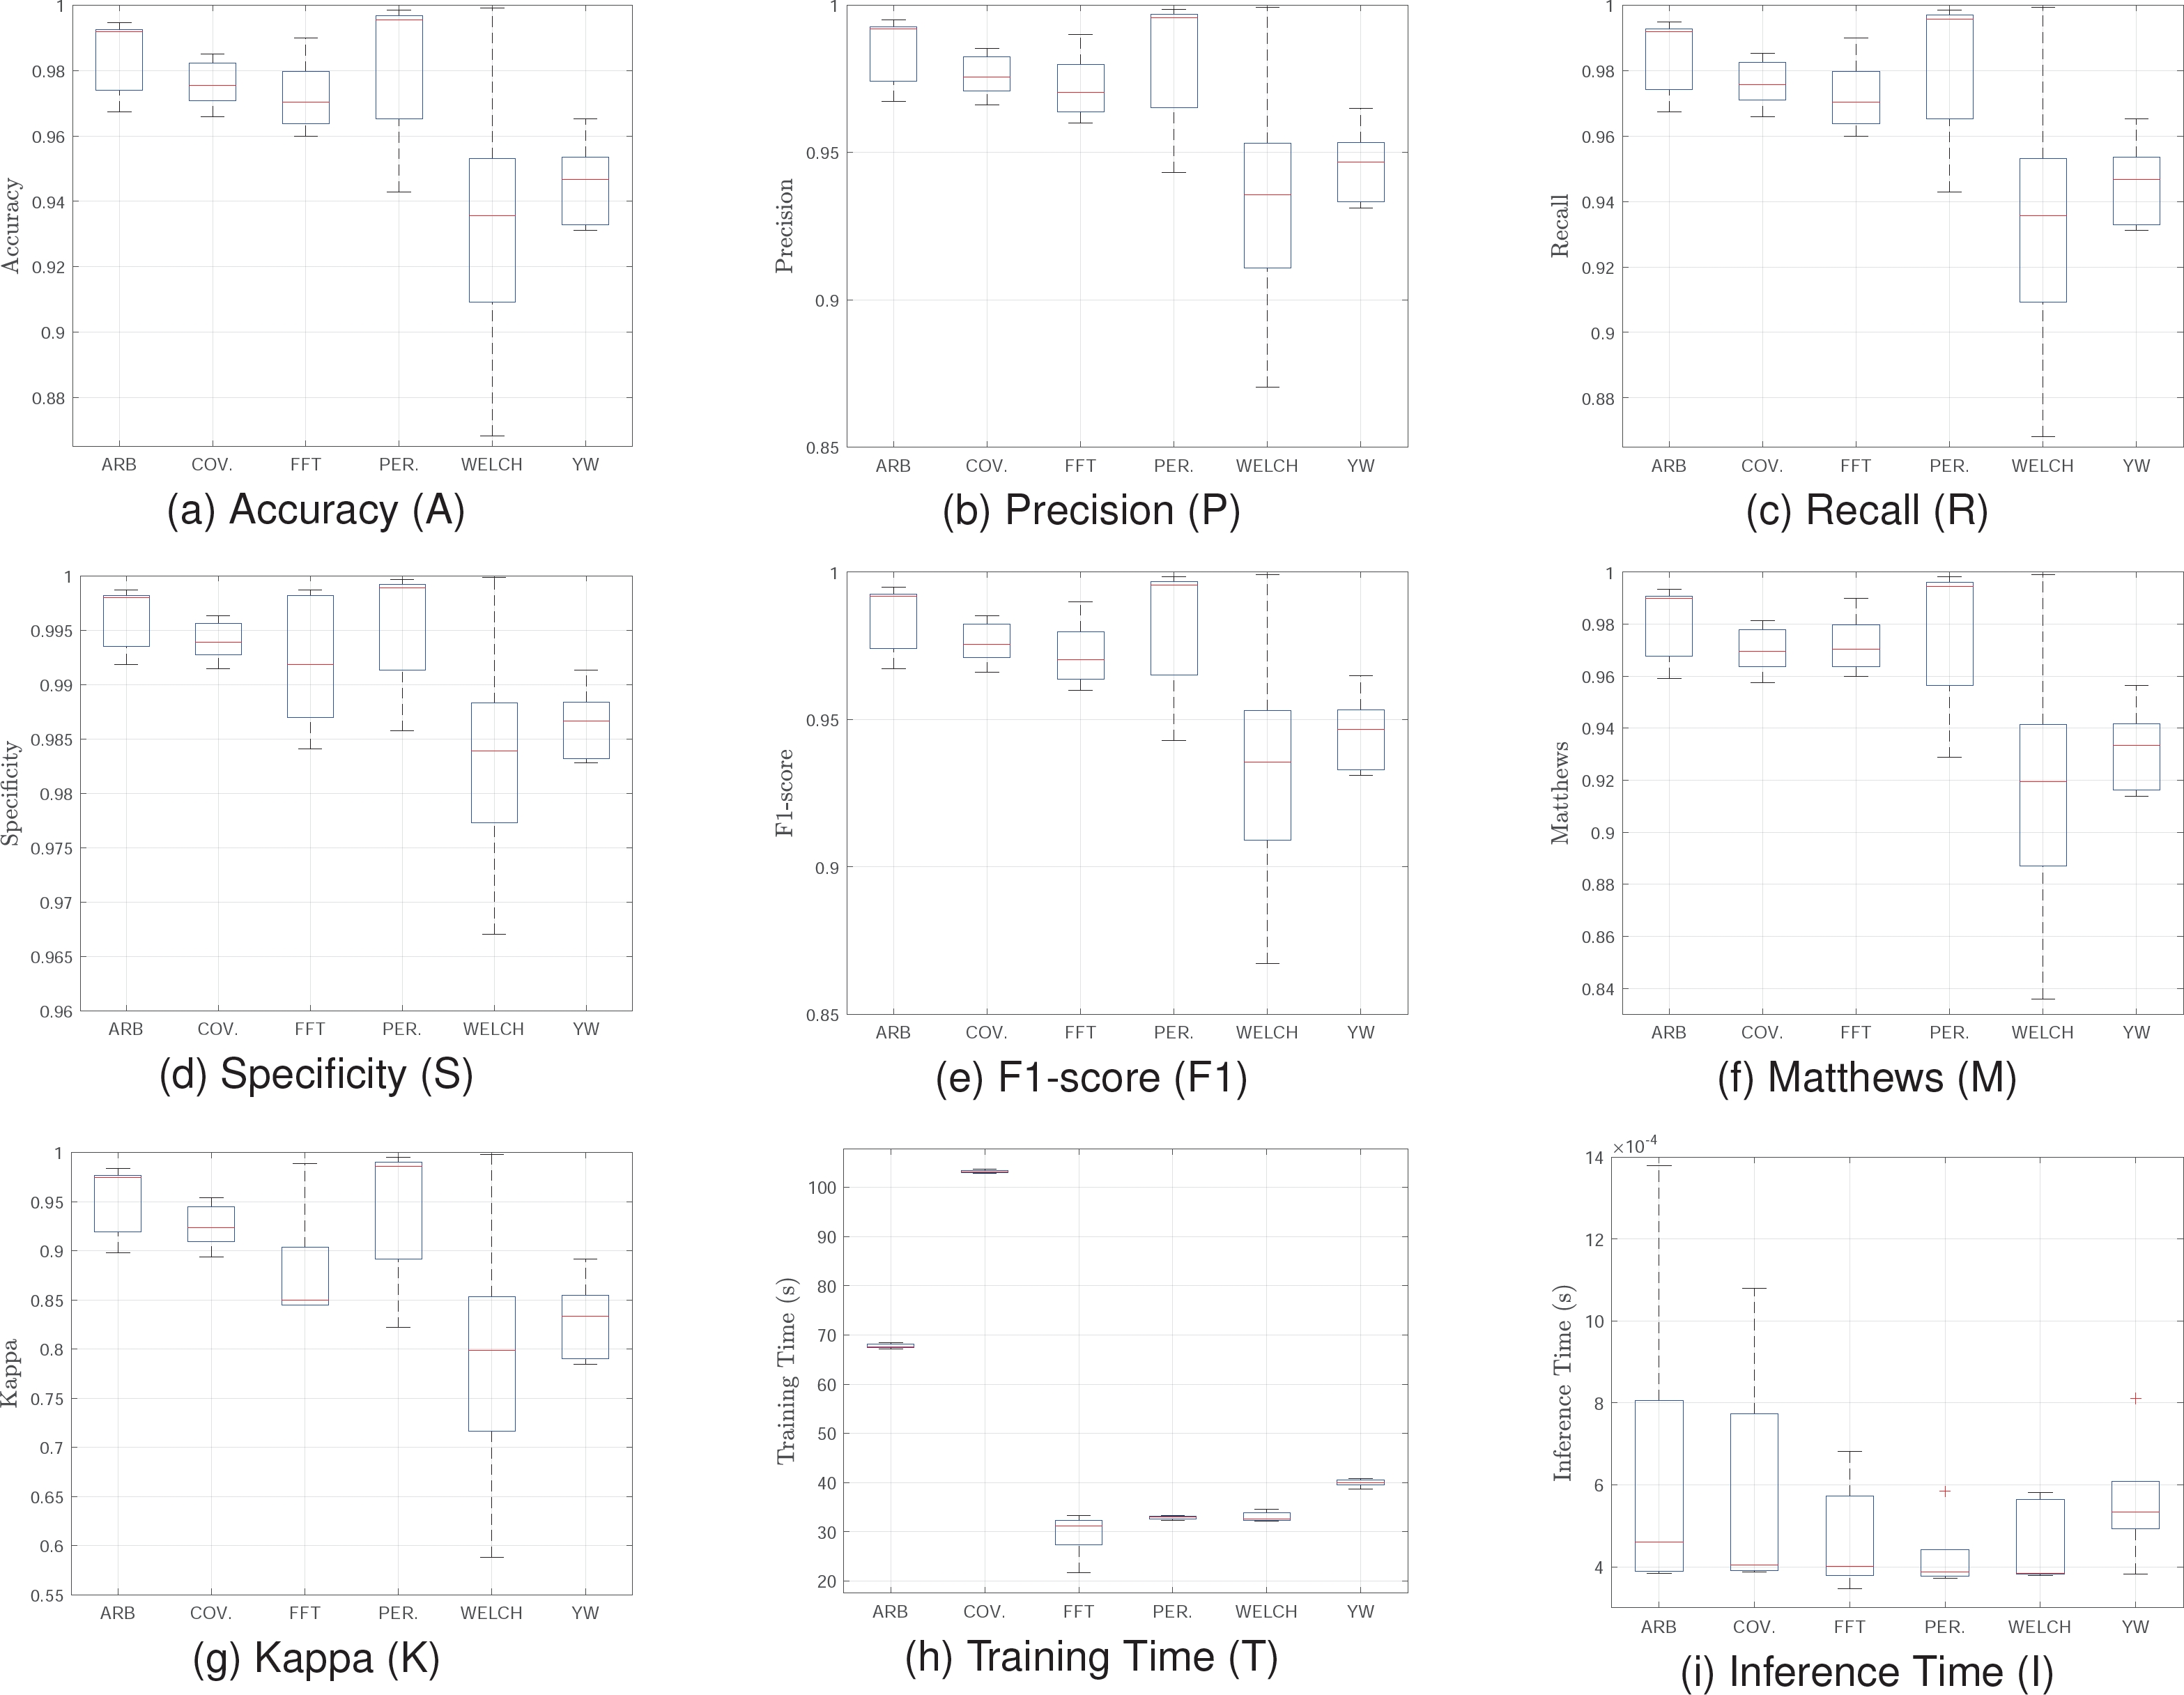
These methods exhibit high medians in all quality metrics, with low variance and no significant outliers. This ensures superior and stable performance, essential for real-time applications or critical environments where precision is paramount.
Although their training times are not the shortest, they remain reasonable compared to Covariance, which, despite achieving good results in several metrics, presents high variance and prolonged training times, rendering it less practical for implementation. Conversely, the FFT method, with significantly lower training times and competitive results in key metrics, emerges as an excellent alternative when computational efficiency is prioritized. For real applications, the FFT model is suggested since it has the best balance between quality metrics and processing time.
4.2 Generalization of the Model
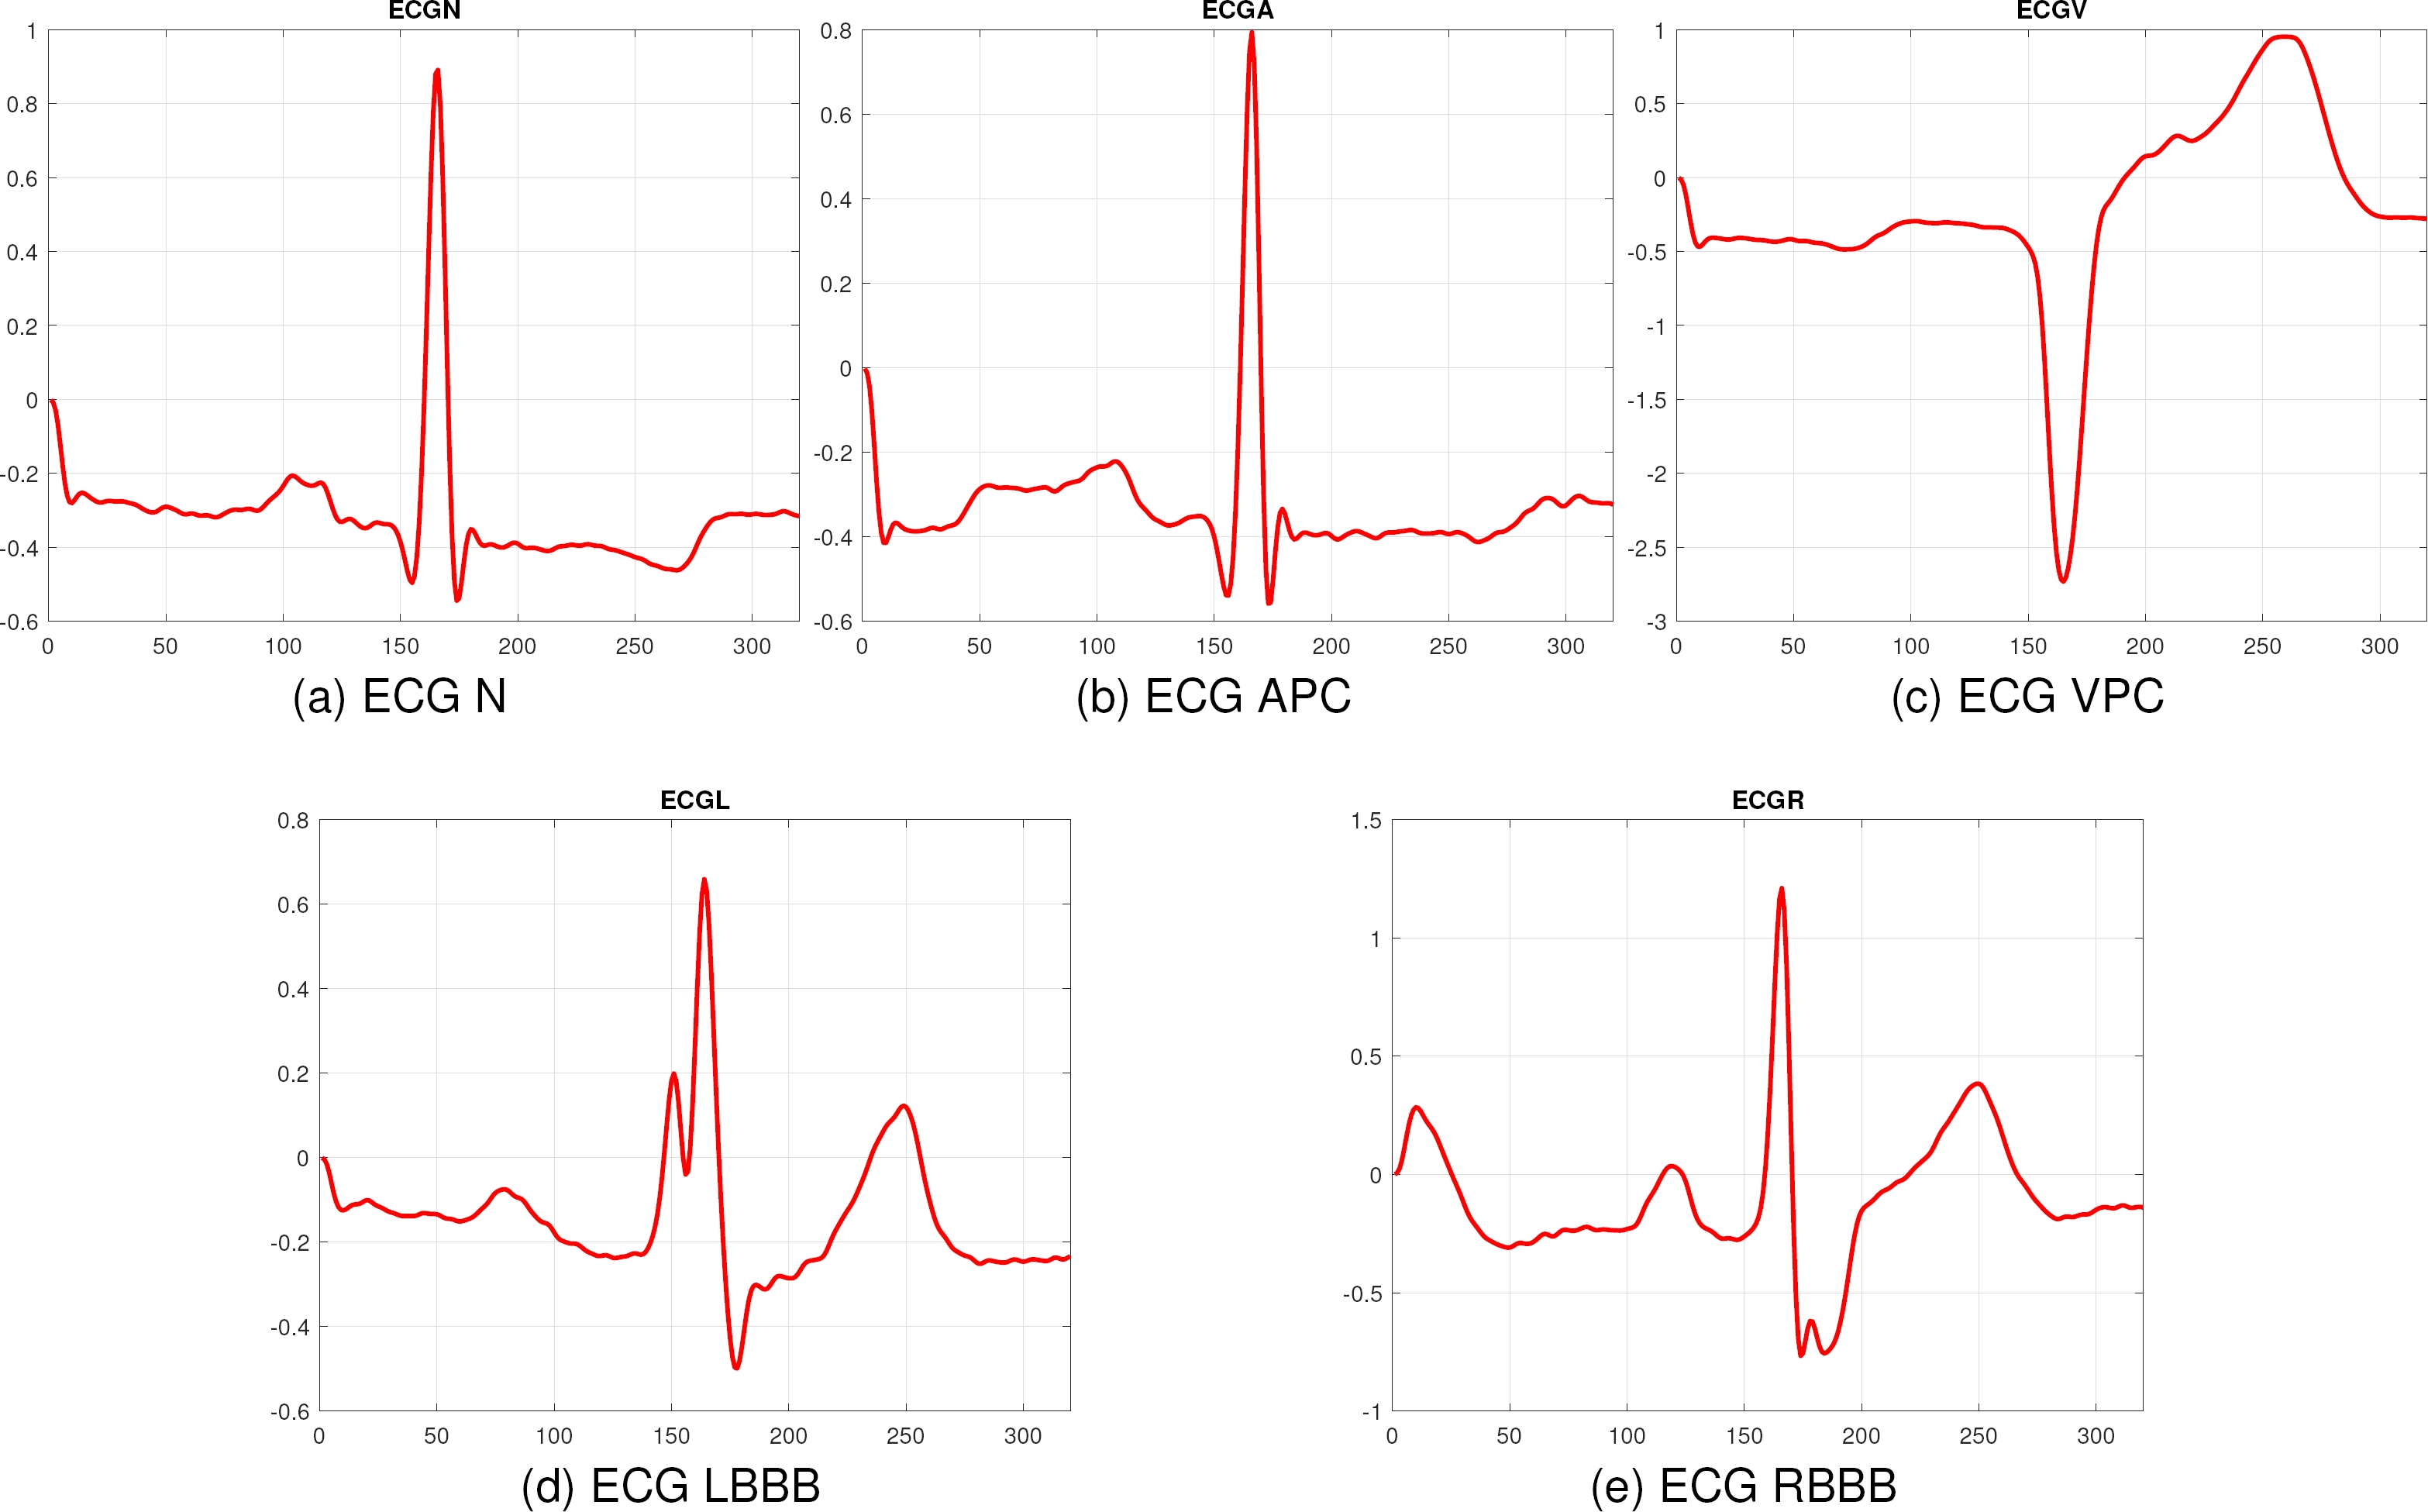
To ensure the robustness and generalization of the proposed method, it was evaluated with another database, corresponding to the MIT-BIH database, which contains 2546 instances for the classes Normal Rhythm (N), Atrial Premature Contraction (APC), Ventricular Premature Contraction (VPC), Left Bundle Branch Block (LBBB), and Right Bundle Branch Block (RBBB). All the signals are the ECG lead II and they were taken at 360Hz. Figure 6 shows a sample of each class.
For the training, the same hyperparameter tuning and configuration for 10-fold cross-validation were used. Figure 7 shows statistical values for the MIT-BIH training. The results demonstrate the effectiveness of the proposed model across different datasets, maintaining high performance in key metrics. The Welch and Periodogram methods exhibit high accuracy and specificity, close to 99%, and excellent precision and recall, surpassing 98%.
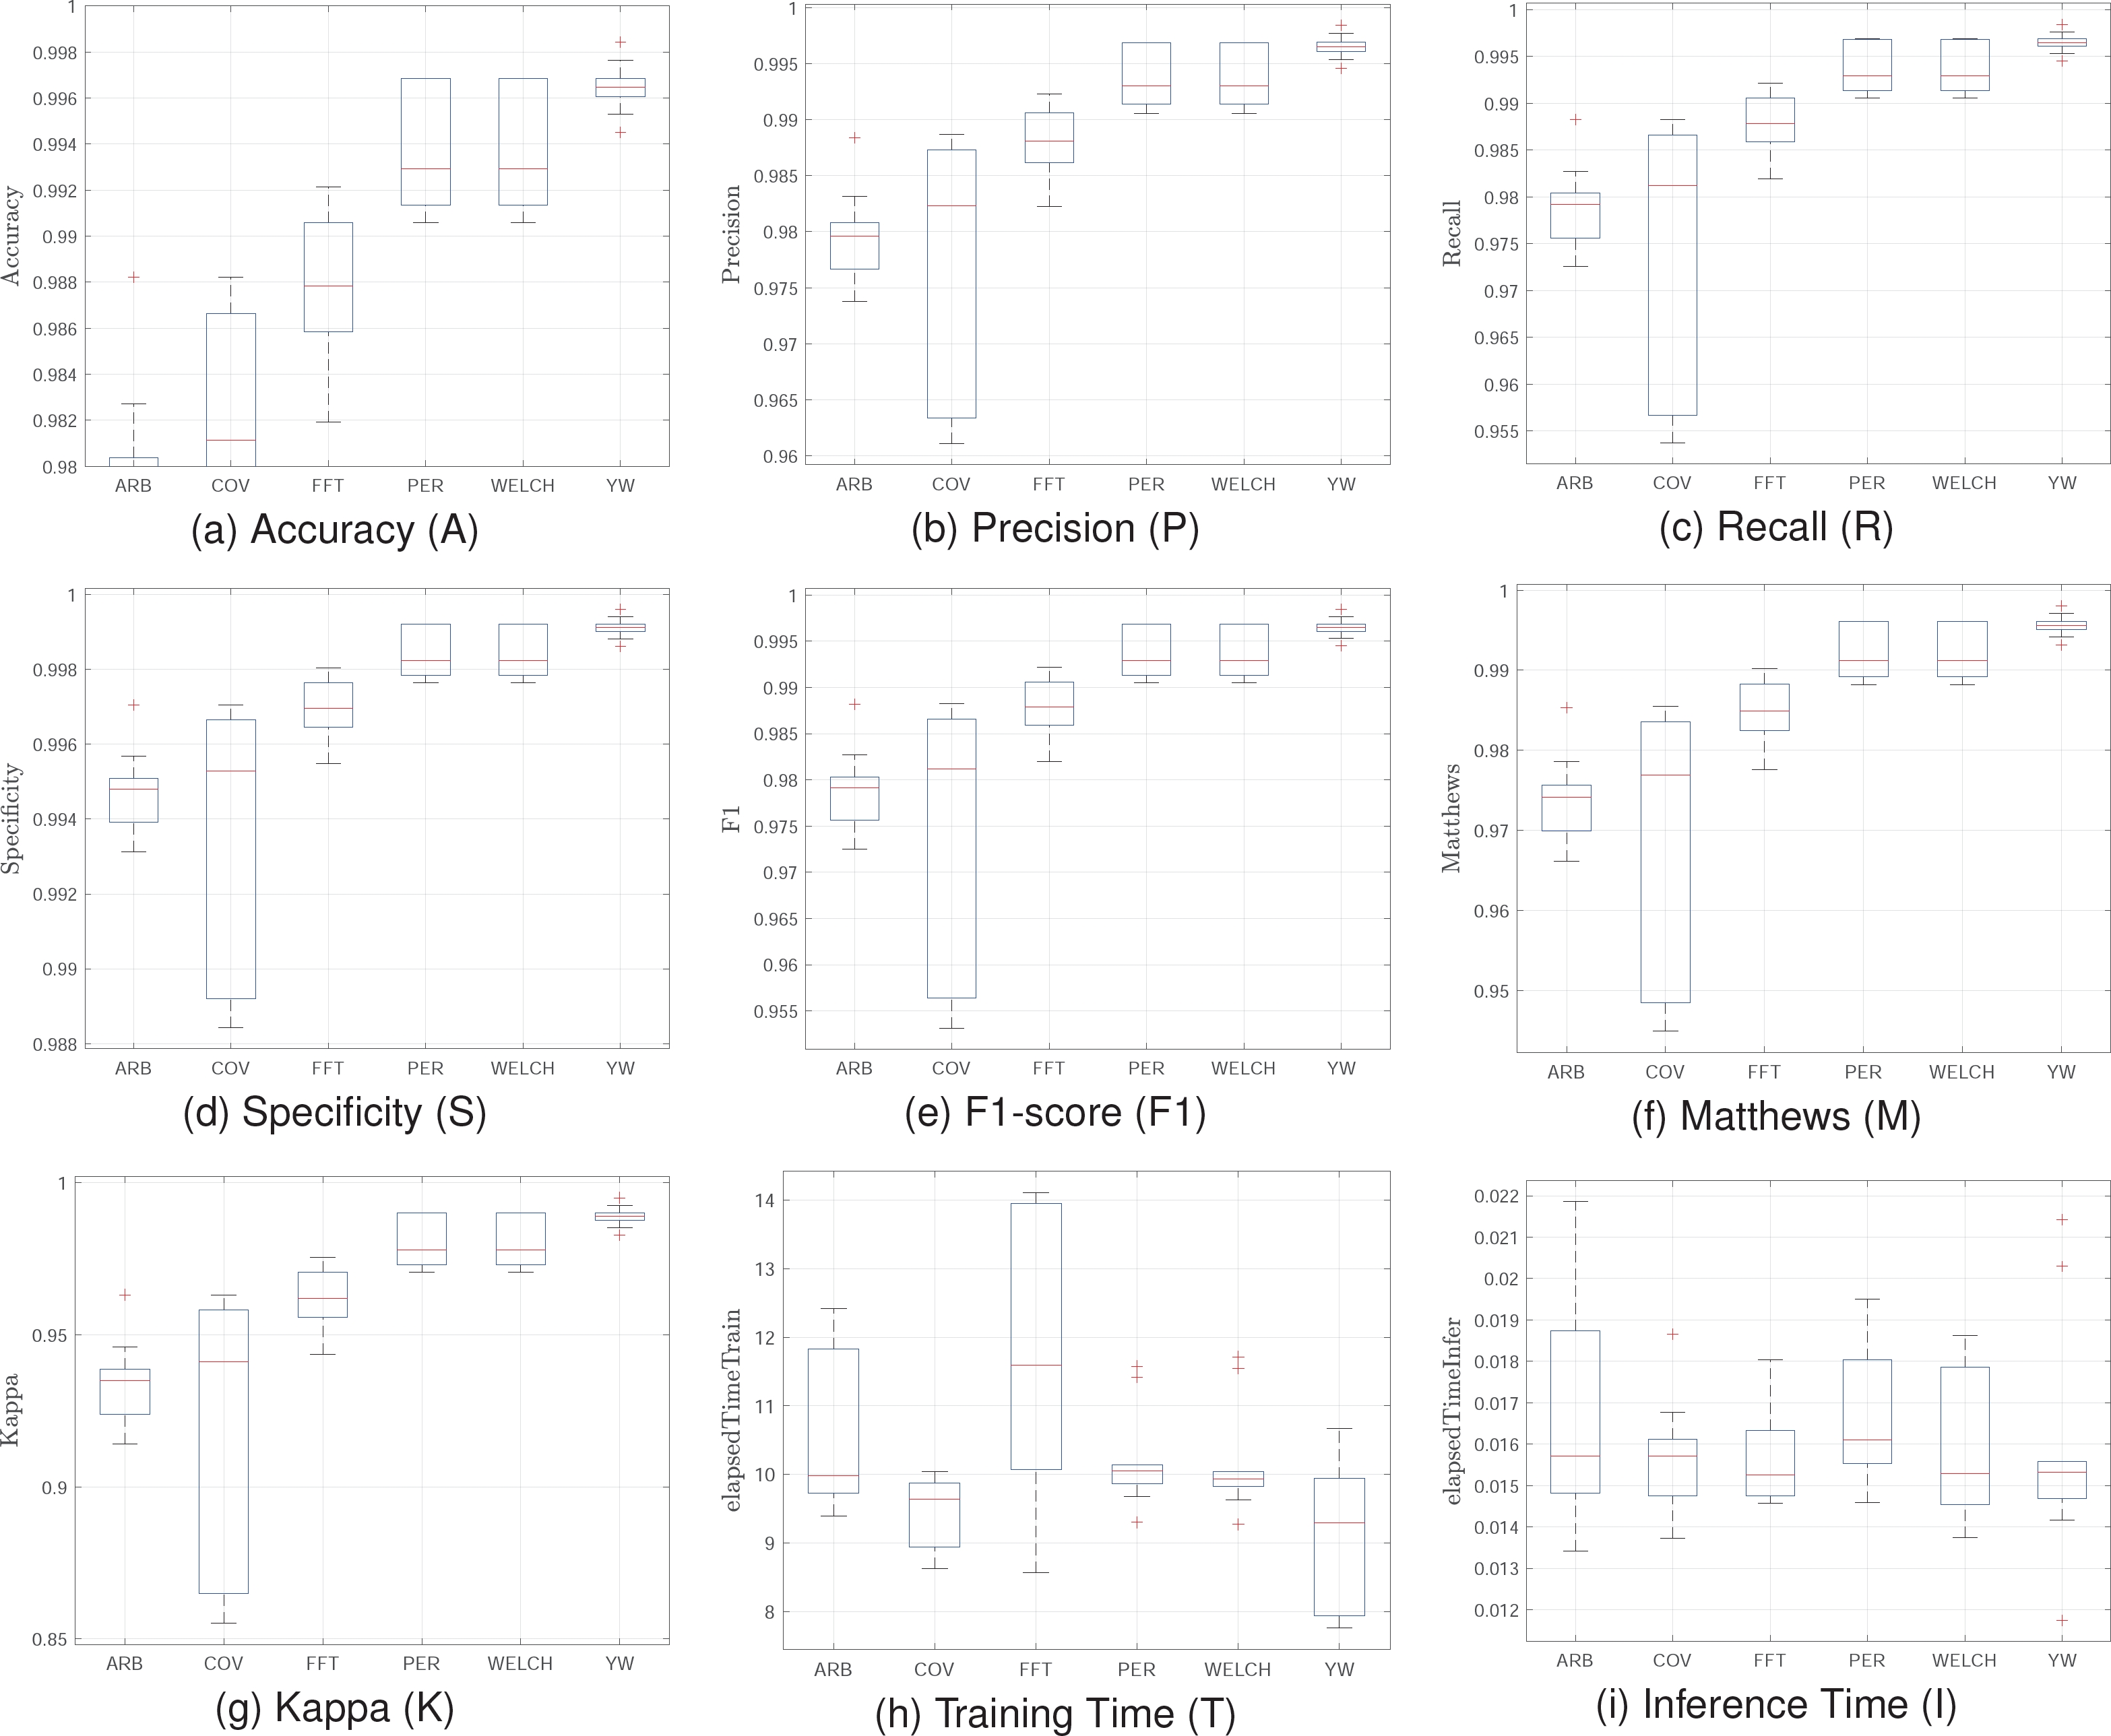
These results indicate the model’s strong ability to distinguish between normal heart rhythms and various arrhythmias, with high sensitivity and precision. Evaluating the model with the MIT-BIH database confirms its generalization capacity and robustness. The Welch and Periodogram methods consistently deliver high accuracy and reliability, while FFT offers an efficient training solution. These findings suggest the model is well-suited for clinical and real-time monitoring applications, providing an effective tool for automatic cardiac arrhythmia classification.
4.3 State of the Art Techniques
Additionally, Table 1 shows average test results of other models used in the state of the art. On the other hand, Table 1 highlights the comparative performance of various state-of-the-art models trained with spectral features.
Table 1 Comparison of results between traditional techniques
| Model | A | P | R | S | F1 | M | K | T (s) | I (s) |
| RanFor | 0.61 | 0.62 | 0.61 | 0.61 | 0.61 | 0.01 | 0.01 | 32 | 0.01 |
| AdaB | 0.63 | 0.64 | 0.63 | 0.64 | 0.63 | 0.02 | 0.02 | 30 | 0.07 |
| NeuNet | 0.67 | 0.75 | 0.67 | 0.70 | 0.64 | 0.02 | 0.02 | 35 | 0.02 |
| NeaNei | 0.81 | 0.81 | 0.81 | 0.81 | 0.81 | 0.84 | 0.83 | 33 | 1.95 |
| BiLSTM | 0.90 | 0.92 | 0.94 | 0.92 | 0.93 | 0.87 | 0.87 | 43 | 0.35 |
The proposed model surpasses these traditional models in quality metrics, showcasing the effectiveness of spectral features for ECG signal classification. Models like Random Forest and AdaBoost exhibit lower accuracy, indicating their struggles with spectral features.
While BiLSTM achieves higher accuracy, it comes with significant computational cost and longer training times, making it less suitable for real-time applications.
This comparison underscores the advantage of using spectral features with deep autoencoders, which offer a robust balance of high performance and computational efficiency, essential for practical and clinical deployments.
5 Conclusions and Future Work
This study presents the design and implementation of a deep spectral autoencoder combined with a fully connected softmax layer, trained using spectral representations of ECG signals for atrial fibrillation classification.
The proposed model achieves high performance across various metrics due to effective preprocessing, which normalizes ECG signals to a consistent length and transforms them into the spectral domain. Spectral representations significantly enhance feature extraction and dimensionality reduction, capturing critical frequency-domain information, thereby improving the model’s effectiveness.
Among the spectral methods used, Welch and Periodogram provide the best results, exhibiting high statistical values in quality metrics with low variance and no significant outliers. Despite longer training times, they are efficient compared to other methods like Covariance.
The FFT method also performs well, offering lower training times and competitive results, making it suitable for computationally efficient implementations, such as low-medium cost embedded systems. The proposed model outperforms traditional state-of-the-art models, demonstrating the advantages of using spectral features with deep autoencoders.
This combination of high performance and computational efficiency makes the model highly suitable for real-time applications and clinical use.
The evaluation with the MIT-BIH database confirms the robustness and generalization capacity of the proposed model. The Welch and Periodogram methods consistently deliver high accuracy and reliability, while the FFT method provides an efficient solution in terms of training time.
These findings suggest that the model is highly applicable in clinical and real-time monitoring environments, providing an effective and efficient tool for the automatic classification of cardiac arrhythmias.
Future work should explore integrating additional models in the central layer to enable deeper analysis and potentially enhance performance. It is crucial to validate the proposed approach with larger and more diverse datasets to ensure the robustness and generalization of the model. These efforts can improve model performance and contribute to developing more efficient and accessible tools for automatic cardiac arrhythmia classification.

