


 nueva página del texto (beta)
 Inglés (pdf)
 Artículo en XML
 Referencias del artículo
 Enviar artículo por email
 Citado por SciELO
  Similares en
SciELO
Similares en
SciELO 
 Permalink
INTRODUCTION
Evaporitic environments can be dated as early as the Archean (3.8-2.5 Ga) (Marty et al., 2018). These depositional settings are transitional and have varied over time (Brigmon et al., 2008). A lot of ions are present in these systems because more water evaporates than falls as rain, creating a wide range of hypersaline conditions (Hollister et al., 2010). Evaporitic systems occur worldwide in marine, lacustrine, tidal flats, solar salterns, brines, salt mines, and salty ponds (Eriksson et al., 2007). They are inhabited by moderate and extreme halophiles that include a great variety of metabolisms (heterotrophs, phototrophs, lithotrophs, and methanogens) from all domains of life (DasSarma & DasSarma, 2017).
Microbes are ubiquitous in nature and harbor diverse metabolic capabilities that allow them to inhabit a wide range of terrestrial and aquatic environments (Paerl & Pinckney, 1996; Ley et al., 2006; Brenner & Arnold, 2008). Microbes are the main components of extremophile environments characterized by high salinity, radiation, extreme temperatures, osmotic stress, or nutrient limitation, including thermal springs, hydrothermal vents, desert soils, and hypersaline evaporitic basins (Li et al., 2014; Cowan et al., 2015). Halophilic microorganisms have characteristic metabolic strategies, including the capacity to pump salt from the environment and accumulate them in the cytoplasm and inversely, thus controlling intracellular conditions (Ning et al., 2019). In hypersaline environments, only a few groups of Archaea are dominant, while at intermediate saline levels, heterotrophic activity is common (Menéndez-Serra et al., 2020). Hypersaline-inhabited microbes contribute to the biogeochemistry of the system by carrying out metabolisms that include carbon fixation, sulfate reduction, methanogenesis, and nitrogen cycling (Kouzuma et al., 2015; Oren et al., 2016); hence, there is a growing interest in their study for potential biotechnological applications (Oren, 2002; Eriksson et al., 2007; Javor, 2012).
However, little is known about the factors that drive the microbial community structure in these extreme environments. It has been postulated that diversity decreases as salinity increases in aquatic environments (Oren, 1999) and that different adaptive strategies have evolved to deal with osmotic regulation (Ning et al., 2019). Thus, selective pressures must be the main drivers of phylogenetic community structure, leading to a species-sorting scenario where similar habitat selection regimes contain similar microbial assemblages (Logares et al., 2018). Nevertheless, variations in community structure, identified from molecular sequences, could also be explained by stochastic processes such as limited dispersal and ecological drift (Zhou & Ning, 2017).
The Vizcaino biosphere reserve comprises a desertic region in the middle of the Baja California Peninsula in Northwestern Mexico. This geosyncline has been filled with a sequence of continental and marine deposits as a result of eustatic changes. Currently, the climate is dry, with an average rainfall below 175 mm. The area is characterized by the occurrence of several evaporitic systems, including Guerrero Negro, Laguna San Ignacio, and Las Charcas, among others. The microbial mats of the Guerrero Negro saltern have been extensively studied (Harris et al., 2013, García-Maldonado et al., 2015, 2023), and recently, the diversity of microbial mats that develop in evaporitic ponds in the Lagoon of San Ignacio (LSI) has been explored, allowing to recover an inverse relationship between diversity and salinity, where each one of the analyzed ponds hosted a specific composition of microbes and also the relevance of methanogenic metabolisms (García-Maldonado et al., 2018). In this study, we aimed to continue the analysis of the microbial composition of evaporitic ponds in the Laguna de San Ignacio, focusing on describing the bacterial and archaeal diversity as well as assessing the factors that determine the community structure in sediments.
MATERIAL AND METHODS
During January 2018, sediment samples were collected in six ponds along an evaporite basin system constituted by a series of independent shallow salty ponds known as “Las Charcas.” These evaporitic salterns are part of an extensive system that adjoins San Ignacio Lagoon and has remained without anthropogenic disturbance (Fig. 1, Table 1). At each pond, three random points were selected, and sediment samples (50 g) were collected from the top 15 cm and pooled to obtain a mixed sample with a sterile plastic spatula. All samples were kept at -20 °C until processed.
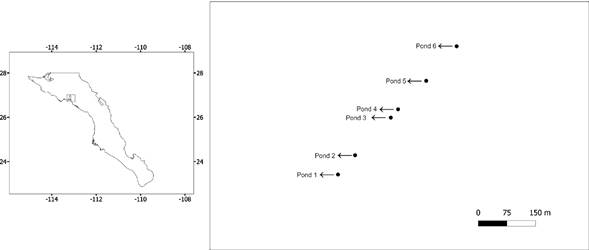
Figure 1 Map of the geographic location of the six evaporite ponds analysed in this study in the vicinity of the San Ignacio Lagoon in Baja California Sur, Mexico
Table 1 Geographic location and biogeochemical parameters evaluated in each one of the six evaporite ponds analysed in this study
| Samplesite | Latitude | Longitude | EC (mS/cm) | Salinity (ppt) | TN (%) | OM (%) | NO2 (mg/Kg) | NO3 (mg/Kg) | NH4 (mg/Kg) | SP (mg/Kg) | Type* |
| Pond 1 | 26.9168 | -113.0941 | 54.20 | 35.84 | 0.05 | 1.30 | <0.100 | 0.60 | 17.5 | 0.90 | Marine |
| Pond 2 | 26.9173 | -113.0937 | 67.00 | 45.58 | 0.15 | 2.60 | <0.100 | 144.00 | 5.50 | 5.80 | Marine |
| Pond 3 | 26.9183 | -113.0927 | 91.90 | 65.74 | 0.21 | 3.40 | <0.100 | 176.00 | 16.80 | 2.50 | Hypersaline |
| Pond 4 | 26.9185 | -113.0925 | 180.60 | 159.30 | 0.12 | 6.20 | <0.100 | 10.60 | 18.30 | 3.40 | Extreme hypersaline |
| Pond 5 | 26.9193 | -113.0918 | 100.30 | 72.92 | 0.18 | 4.00 | <0.100 | 176.00 | 25.60 | 2.50 | Hypersaline |
| Pond 6 | 26.9202 | -113.0910 | 162.90 | 131.30 | 0.20 | 6.20 | <0.100 | 101.00 | 1.70 | 5.80 | Hypersaline |
EC: Electroconductivity, TN: Total Nitrogen, OM: Organic matter, SP: Soluble Phosphorus. * Salinity was obtained following Menéndez-Serra et al. 2021
Biogeochemical parameters
For each sampling site, electric conductivity (EC) was measured with a LAQUAact-EC110 conductivity meter (ABQ Industrial), on the other hand, biogeochemical parameters such as organic matter (OM), soluble forms of nitrogen (NH4+, NO3−, and NO2−), total nitrogen, and soluble phosphorus were determined at the Laboratory of Chemical Water Analysis of the CIBNOR. Electroconductivity were translated into salinity (ppt) using the capital city aquatics salinity converter tool (https://www.capitalcityaquatics.com/salinity).
DNA extraction
Total environmental DNA was extracted from sediment samples using the UltraClean Soil DNA isolation kit (MoBio Laboratories Inc.) according to the manufacturer’s instructions. After that, DNA yields were quantified with a photometer (Eppendorf ® Hamburg, Germany), and the quality was visualized in a 1% (w/v) agarose gel.
16S rRNA amplification
The hypervariable V4 region of the 16S rRNA gene was amplified with the universal bacteria/archaeal primers 515F/806R (Caporaso et al., 2011). Amplicon libraries consisted of triplicate PCR reactions of 25 µl containing Takara ExTaq PCR buffer 10X, Takara dNTP mix (2.5 mM), 0.7 µl of bovine serum albumin (BSA, 20 mg ml-1), each primer at 0.4 µM, 0.625 U of Takara Ex Taq DNA Polymerase (Takara, Shiga, Japan), and 2 µl of DNA template. The PCR protocol included an initial denaturation step at 95°C (3 min), followed by 35 cycles of 95°C (30s), 52°C (40s), and 72°C (90s), with a final extension at 72°C for 12 min. Amplicons were pooled and purified using magnetic beads. The purified 16S rRNA fragments of the sediments from the six ponds analyzed were sequenced on an IlluminaMiSeq platform (Yale Center for Genome Analysis, CT, USA), generating 250 bp paired-end reads. All sequences obtained were uploaded to the NCBI database under the bioproject number PRJNA962895.
The 16S rRNA gene V4 sequences were processed in R using the DADA2 pipeline (Callahan et al., 2016) with the following filter parameters (truncLen=c (240,200), maxN=0, maxEE=c (2,2), truncQ=2, rm.phix=TRUE, compress=TRUE, multithread=FALSE); after filtering, the sequences were denoised and merged, and the chimeras were removed. The remaining ASVs were taxonomically assigned with the Bayesian classifier using the SILVA 138.1 database as a reference (Yilmaz et al., 2014) using the assign taxonomy function. Finally, the assignment and abundance tables were exported to R for further analysis.
In this study, we indicate the new prokaryote classification in parenthesis. Since diversity estimators are very sensitive to the number of sequences read in the library, normalization approaches such as rarefaction are used to compare samples with different library sizes; thus, in this paper, we used the recently described procedure of repeated rarefaction as implemented in the library myrlin (Cameron et al., 2021). First, we used the rarefy_whole_rep over 1000 replicates and the rarecurve function to assess the minimum library size. Multiple iterations of the rarefying libraries were generated with the function mirl over 1000 replicates without replacement, and the alphadivDF function was used to estimate diversity indexes for the multiple iterations of the rarefying libraries. The alphacone function was applied to evaluate the effect of different rarefied library sizes on the Shannon index. Additionally, we estimated the Shannon diversity index from the non-rarefied dataset as implemented in Microeco (Liu et al., 2021) to compare results. A Spearman correlation test was performed to evaluate if the differences in the Shannon index were correlated with the biogeochemical parameters evaluated. The rest of the analysis was performed with the complete data set without rarefaction.
The sequences were aligned in Seaview (Gouy et al., 2010), and a phylogenetic tree was built in RAxML (Stamatakis, 2015) using a GTR +Γ substitution model with 100 bootstrap replicates, keeping the best tree as the hypothesis of phylogeny. The phylogenetic tree and the abundance and assignment tables were imported into Phyloseq (McMurdie & Holmes, 2013) and microeco objects (Liu et al., 2021) for further analysis. Relative abundance bar plots per pond at the phylum level were obtained using the microeco package, where groups with less than 1% of relative abundance were clustered into other groups, as well as genera with relative abundances lower than 1% (Pedrós-Alió, 2012) that were also recovered.
Beta diversity was analyzed from PCoA ordinations calculated using weighted UniFrac, unweighted UniFrac, and Bray-Curtis metrics to compare the six ponds. Additionally, to detect the differences in diversity composition associated with the biogeochemical parameters, a Canonical Correspondence Analysis (CCA) with Hellinger transformation (Legendre & Gallagher, 2001) was used in vegan with 10,000 permutations (Oksanen et al., 2007), as well as a Mantel test to evaluate if the differences were correlated either with the biogeochemical parameters or the geographic distance among ponds using vegan.
To evaluate the phylogenetic community structure of each pond, the nearest relatedness index (NRI) and nearest taxon index (NTI) statistics (Webb 2000) were estimated in the metagMisc package (https://www.github.com/vmikk/metagMisc) with 1000 permutations. Briefly, NRI estimate the overall phylogenetic distance among all pair of taxa within a community, on the other hand, NTI measures the phylogenetic pairwise distance between the closed related taxa, negative values of both estimators indicate phylogenetic overdispersion, in other words, communities where competition is the main driver of community structure; on the other hand, positive values indicate phylogenetic clustering, where habitat filtering rules the community structure.
A modification of the Raup-Crick test based on Bray-Curtis distance was performed in microeco with 1000 permutations to evaluate the relative importance of stochastic and deterministic processes in the complete community of ponds. The Raup-Crick test allows disentangling the relative contribution of variable selection, which refers to shifts in environmental conditions that lead to different selective pressures that in turn cause community composition turnover. Homogeneous selection refers to the biotic and abiotic factors that lead to similar community structures. Homogenous dispersal refers to high levels of organism dispersion that lead to low levels of turnover among communities; dispersal limitation refers to the impossibility of an organism migrating due to geographic distance or environmental filtering; and ecological drift refers to stochastic processes that promote population size fluctuations that lead to extinction only by chance and variable selection (Oren, 2002; Stegen et al., 2013, 2015; Wang et al., 2022). Finally, to evaluate the fit of the communities to a neutral model, we used the model proposed by Sloan et al. (2006), following the procedure described by Burns et al. (2016). Briefly, the model predicts that taxa that showed high abundances in sampled ponds will also be widespread across ponds because they are more likely to disperse and be sampled in a pond. In other words, OTUs that fit within the 95% confidence limits of the model are assumed to be driven by stochastic factors such as dispersal and ecological drift; meanwhile, OTUs with observed frequencies above expected are driven by selective pressures; and finally, OTUs with frequencies below expected are explained as taxa with low dispersal potential.
RESULTS
Despite their geographic proximity, the six evaporitic ponds showed different characteristics, specifically in the salinity: ponds 1 and 2 were classified as marine (35.8-45.5 ppt), ponds 3, 5, and 6 were classified as hypersaline (65.7-131.3 ppt), and finally, pond 4 was classified as extreme hypersaline (159.3 ppt). Marine ponds showed a lower amount of organic matter, while the highest amount was found in one hypersaline pond (pond 6) and the extreme hypersaline pond (4). Total nitrogen ranges from 0.05% in marine pond 1 to 0.210% in hypersaline pond 3. All ponds showed low values of nitrites, and the nitrates range widely from very low values of 0.6 mg/kg in marine pond 1 and extreme hypersaline pond 4 up to 176 mg/kg in the hypersaline ponds 3 and 5. Finally, soluble phosphorus showed the lowest value of 0.9 mg/kg in marine pond 1 and the highest in marine pond 2 and hypersaline pond 6 (5.8 mg/kg) (Table 1).
The number of reads recovered for the 16S rRNA amplification of the gene V4 hypervariable region was 631 947, and 230 349 sequences remained after quality filtering. The number of sequences ranged widely from 14 603 (pond 1) to 57 229 (pond 3) (Table 1). The minimum library size was defined at 6, 000 sequences after rarefaction, according to Myrlin. The Shannon index on the rarefaction data set ranged from (H = 5.33, sd = 0.0081) in pond 1 up to (H = 6.23, sd = 0.0104) in pond 6 (Table 2). Similar results were recovered for the non-rarefied dataset (not shown). The Shannon diversity index was positively correlated with electric conductivity (r = 0.8857, P = 0.0333) and organic matter (r = 0.9276, P = 0.0076), hence diversity increased with conductivity.
Table 2 Diversity Shannon index (H) values estimated for each one of the six evaporite ponds analysed in this study after 1000 replicates. The mean (X), mimimum, maximum and standard deviation estimators are presented
| Samplesite | (X) | Minimum | Maximum | Sd | Number of sequences |
| Pond 1 | 5.33 | 5.31 | 5.35 | 0.01 | 14603 |
| Pond 2 | 5.95 | 5.93 | 5.98 | 0.01 | 37535 |
| Pond 3 | 5.78 | 5.74 | 5.81 | 0.01 | 57229 |
| Pond 4 | 6.13 | 6.10 | 6.16 | 0.01 | 42183 |
| Pond 5 | 6.04 | 6.01 | 6.07 | 0.01 | 32634 |
| Pond 6 | 6.23 | 6.21 | 6.26 | 0.01 | 46165 |
Bacterial phyla in Las Charcas evaporitic pond sediments were the most abundant, representing over 80% of ASVs in all samples. Desulfobacterota and Myxococcota were the main components in all ponds, ranging from 37.8% in pond 3 up to 57.4% in pond 1, followed by Bacteroidota (Bacteroidetes) (12.6% in pond 1 to 22.7% in pond 5). Other abundant phyla were Firmicutes (Bacillota) (4.9% to 12%), Spirochaetes (Spirochaetota) (2.9% to 6.7%), Mycoplasmatota (Tenericutes) (1.2% to 7%), Cyanobacteria (0.46% to 2.62%), Verrucomicrobiota (1.1% to 7.8%), Chloroflexi (Chloroflexota) (0.5% to 5%), and Woesearcheota (1.5% to 3.9%) (Fig. 2).
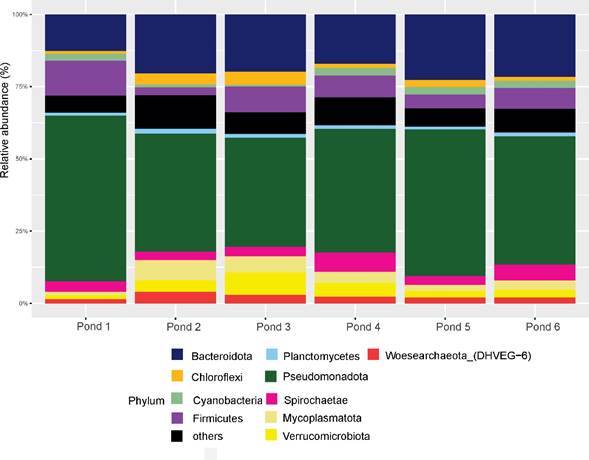
Figure 2 Barplot of the most abundant bacterial and archaean phyla present in the six evaporite ponds analysed in this study
The most abundant genera belong mainly to the sulfate-reducing, fermentative Desulfobacterota, followed by Myxococcota and Campylobacterota. Desulfotignum ranges in abundance from 2.9% to 6.9% and is present in all sites. Other abundant genera varied between ponds: Desulfopila (8.7%) and the Fe-reducing bacteria Desulfuromusa (5.6%), pond 1; Spirochaeta (4.1%) and Marinobacter (3.8%), pond 2; sulfate-reducer Desulfocella (6.4%), pond 4; Spirochaeta_2 (4.9%), Desulfomicrobium (4%), pond 3; and Desulfotignum (6.9% and 5.3%), ponds 5 and 6, respectively (Fig. 3). The proportion of rare genera (abundance lower than 1%) was high, ranging from 84.9% in pond 1 up to 91% in pond 2 (Fig 3), and the proportion of very rare genera (abundance lower than 0.01%) ranged from 49% in pond 1 to 62.5% in pond 2 (Fig. S1).
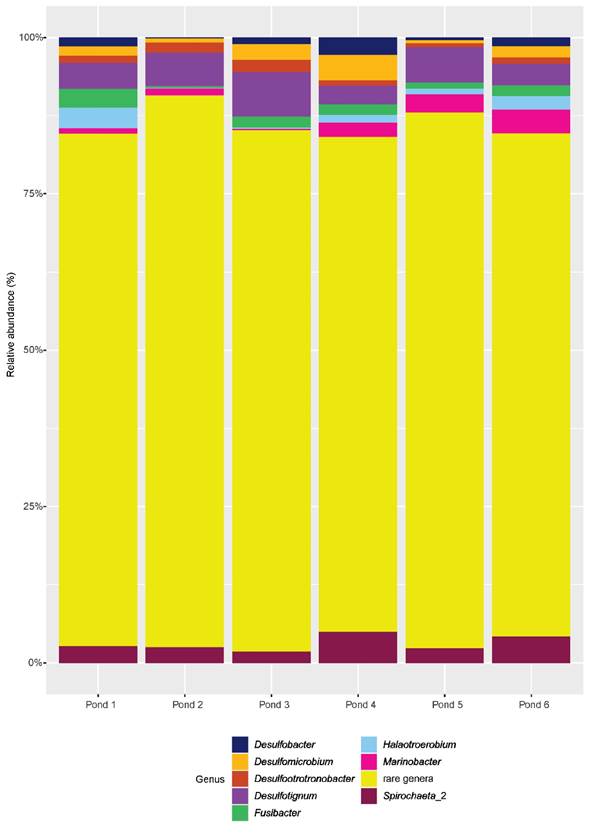
Figure 3 Barplot of the most abundant bacterial genera present in the six evaporite ponds analysed in this study.
The percentage of variance explained by the first two axes in the beta diversity analysis ranged from 43% in the unifrac unweighted distance (S2 Fig. B) up to 76.5% for the unifrac weighted distance (Fig. S2 item C), where the beta distance ranges from 0.1217 between pond 4 and pond 6 for the unifrac weighted distance to 0.9100 between ponds 1 and 3 for the Bray Curtis index (Table S1). The first two axes of the CCA analyses explained 43.5% of the variance, where ponds 4 and 6 are related to the amount of organic matter and conductivity, while ponds 2 and 3 are related to the amount of total nitrogen and nitrates (Fig. 4). The Mantel test showed that the differences in community composition among ponds are not related to geochemical parameters or geographic distance (P > 0.05).
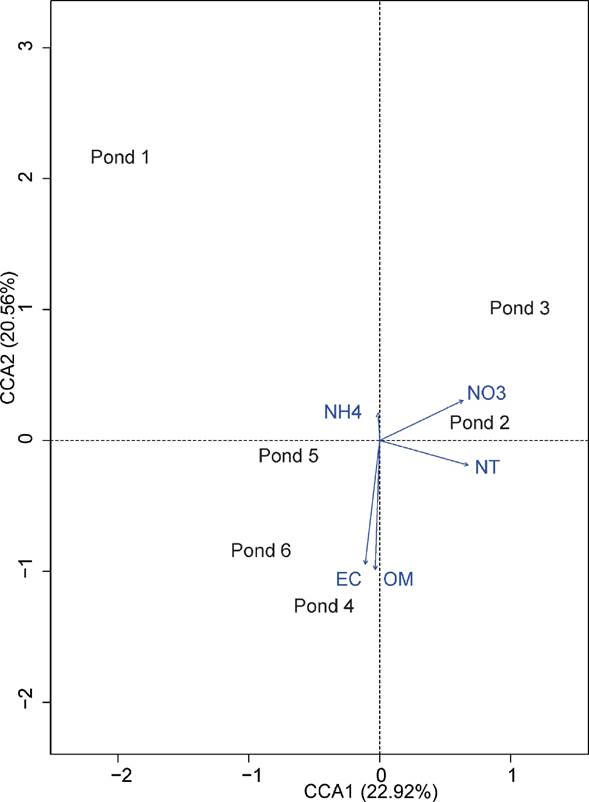
Figure 4 Canonical correspondence analysis (CCA) ordination biplot of the six evaporite ponds analysed in this study showing their relationships with the five explanatory biogeochemical variables
The nearest taxon index (NTI) values were zero in all the analyzed samples, on the other hand, the nearest related index (NRI) yielded negative results in ponds 1 and 5, suggesting the occurrence of phylogenetic overdispersion. In the rest of the ponds, the NRI statistic yielded positive values indicating phylogenetic clustering (Table 3). Further, the Raup-Crick metric suggests that homogeneous selection is the principal factor that determines the differences in community structure among ponds (33.33%), followed by homogeneous dispersal (26.66%), whereas dispersal limitation and ecological drift contribute 20%, with a null contribution of variable selection (Table 4). Finally, the model predicts that most of the OTU abundances in the evaporitic pond communities are explained by a neutral model (93.46%); meanwhile, only a small proportion (3.70%) showed an observed frequency above expected, including bacteria involved in the sulfur cycle such as the phylum Desulfobacterota and archaeans of the phyla Bathyarchaeota and Woesearhcheota that are positively selected in the communities (Fig. S3, Table S2).
Table 3 Phylogenetic community structure of the six evaporite ponds analysed in this study estimated through the use of Near related index (NRI) and Near Taxon index (NTI)
| Samplesite | (NRI) | (NTI) |
| Pond 1 | -2.2305 | 0.0000 |
| Pond 2 | 0.0628 | 0.0000 |
| Pond 3 | 0.7111 | 0.0000 |
| Pond 4 | 0.9502 | 0.0000 |
| Pond 5 | -2.2093 | 0.0000 |
| Pond 6 | 0.1047 | 0.0000 |
DISCUSSION
The research presented here complements previous studies that have characterized the microbial diversity and biogeochemical contributions to evaporitic environments in the LSI Baja California, Mexico. Evaporitic ponds are shown to be similar in their biogeochemical roles yet distinct in their compositions, suggesting a restricted connectivity between ponds that act as independent evaporitic entities. The role of sulfur-reducing bacteria could be suggested as a key component of all sediments analyzed, opening our understanding of evaporitic ecosystems, where microbial mats harbor a different composition, apparently in charge of C-transformations, particularly methane (García-Maldonado et al. 2018), whereas sediments mainly contribute to S-cycling (Fig. S4). We could highlight the dominance and positive selection of both bacteria and archaeans involved in the sulfur cycle (Table S2). For example, the Desulfobacterota (previously Deltaproteobacteria) (Liu & Häggblom, 2018) are involved in sulfate reduction and have been proposed as the main mineralization process in a great diversity of environments, as has been evidenced here in evaporation ponds, including genus such as Desulfotignum, Desulfopila and Desulfocella (Table S3), which are sulfate-reducers that have been characterized in intertidal permeable sediments that serve as sites of accumulation of organic matter, harboring a great microbial diversity (Brandt et al., 1999; Gittel et al., 2010). On the other hand, the more abundant Archaeans belong to the phyla Woesearcheota (Fig. 2) and are dominant in anoxic environments, sediments, and sulfuric springs (Zhou et al., 2018; Liu et al., 2021b). It has been documented that several factors influence the bacterial communities in sediments, including salinity, organic matter, phosphorus, and nitrogen content (Ikenaga et al. 2010), as well as geographic distance (Finstad et al., 2017; Violle et al., 2017); nevertheless, despite all sampled ponds analyzed in this study showed differences in composition and abundance (Fig 2), none of the biogeochemical parameters analyzed or the geographic distance were associated with the observed differences (P > 0.05 according with Mantel test). For the aforementioned, we can postulate that the bacterial community ensembles here analyzed are shaped by a series of deterministic ecological factors such as microbial traits, biological interactions, and environmental conditions (e.g., environmental filtering) that are usually more important in environments with steep gradients, and stochastic processes include colonization, extinction, and speciation that are prevalent in more homogeneous environments (Huang et al., 2022). It is difficult to fully associate the differences in diversity patterns recovered among ponds with a single variable due to the fact that all samples only represent a snapshot of the system, and we were not able to evaluate changes through time and the effect of potential perturbations. However, in other studies performed in evaporite ponds, it has been found that repeated samples through time recovered similar patterns despite the fact that most of the diversity proceeds from the rare biosphere (Bowen et al., 2012), allowing us to suggest selective pressures as an important driver of community ensembles in these systems, as has been suggested by the small proportion of taxa that showed signals of being positively selected according to the Sloan neutral model (Fig. S3, Table S2). On the other hand, the community ensembles analyzed in this study could be mainly determined by stochastic processes such as ecological drift, considering that these evaporitic environments do not share a hydrological flow that would be the main agent for homogenization. Thus, ecological drift could be an important stochastic factor that drives changes in the rare biosphere of a microbiome, particularly in the transient rare taxa (TRT), which refers to the taxa that disappeared from one sample to another in opposition to the permanent rare taxa (PRT), which refers to taxa that disappear across biogeographic and seasonal patterns that are driven by deterministic processes (Jia et al., 2018). The role of the rare biosphere has been widely discussed; some authors suggest that members of the rare biosphere represent a genomic reservoir and that these rare taxa could become dominant after a drastic change in environmental conditions (Shade et al., 2014); on the other hand, other studies have revealed their importance in the biogeochemical cycles in terrestrial and marine environments (Martiny et al., 2006). Nevertheless, there is a lack of consensus regarding the threshold abundance value to consider a taxon to be rare. For example, Medina-Chávez and Travisano (2022) recently split taxa into rare (relative abundance lower than 0.1%) and strictly rare (relative abundance lower than 0.01%); thus, according to their proposal, in our evaporite basins, the proportion of rare taxa was higher than 96% and the proportion of strictly rare taxa was higher than 52%; nevertheless, contrary to what would be expected, the proportion of rare taxa does not increase to their proposal, in our evaporite basins, the proportion of rare taxa was higher than 96% and the proportion of strictly rare taxa was higher than 52%; nevertheless, contrary to what would be expected, the proportion of rare taxa does not increase with the total number of OTUs (Locey & Lennon, 2016), leading to the suggestion that the term rarity must be used beyond an abundance value. Thus, the term rarity must include all the facets that a taxon must match to be considered a real rarity beyond abundance, such as geographic range, habitat specificity, and functional traits (Uritskiy et al., 2020). The diversity levels found in this study (Shannon index) varied widely among the different ponds. One of the possible explanations relies on the use of rarefaction datasets (McMurdie & Holmes, 2014; Willis, 2019). In this study, we used a recently published approach that used repetitive rarefying to avoid the concerns associated with the use of random or omission data (Callahan et al., 2016). However, recently, Schmidt et al. (2022) warned about the negative effect of repeated rarefaction since this leads to a decrease in the Shannon index of larger libraries and wrongly suggests that the diversity levels are similar among different library sizes. Results from this study showed that the highest range in the Shannon index corresponds to the ponds with the lower number of sequences and that the value decreases as several sequences increase (Table 1 and Table 2), supporting the idea that repeated rarefaction estimators must be used with caution. However, the estimated intervals did not show overlap, and the estimated values were similar to those recovered from analysis without rarefaction (data not shown), so we can conclude that the differences in diversity are real and not an artifact of the procedure. Diversity values found in this study showed a strong correlation with salinity levels (Table 1), a result that contrasts with previous papers that suggest that species richness must decrease with increasing salinity (Casamayor et al., 2000; Benlloch et al., 2002; Baati et al., 2008), but is similar to other published studies that found an increase in diversity with salinity levels (Yang et al., 2016, Menéndez-Serra et al. 2021). For example, Dillon et al. (2013) found that archaeal diversity is higher than bacterial diversity as salinity increases; however, our results found that the proportion of archaea was low, ranging from 1.65% to 4.53% without a pattern related to salinity levels. Thus, further investigation of the microbial diversity in other biomes within the evaporitic ponds, e.g., water and sedimentary columns, as well as their temporal variation, would be necessary to fully understanding the dynamic of these ecosystems.
CONCLUSIONS
The hypersaline aquatic system analyzed here is made up of contiguous evaporation ponds, although diversity was associated with salinity, other factors remained insignificant in explaining the patterns of pond-specific diversity. Fort the aforementioned, we conclude that the main processes maintaining species coexistence are homogeneous selection and ecological drift due to the high percentage of rare biospheres; thus, low-abundance taxa are more prone to experiencing random fluctuations in their abundance, leading to highly differentiated communities over relatively short distances with no pattern related to the geographic distance. Finally, the study of salty ponds provides unique habitats for organisms, which can provide information on adaptive strategies and a better understanding of the diversity of life, as well as their potential use for biotechnological applications in the future.

