


 nueva página del texto (beta)
 Inglés (pdf)
 Artículo en XML
 Referencias del artículo
 Enviar artículo por email
 Citado por SciELO
  Similares en
SciELO
Similares en
SciELO 
 Permalink
1. Introduction
Cuba has a variety of metallic and industrial mineral occurrences throughout the national territory belonging to different geological conditions and environments. One of the perspectives for gold mineralization and base metals is found in the region of the Cretaceous Volcanic Arcs (CVA), which it extends from the east of the province of Ciego de Ávila to the boundaries of Las Tunas province. Studies carried out in this region since the first half of the 20th century have revealed several mineral areas prospects that have been exploited only in small areas. The first ones took place during the neocolonial epoch (1902-1958), with the exploitation of alluvial gold (López et al., 2017), until more recently, when the area of interest has gained a higher mineral value.
Subsequent and continuous geological researchers have had as their main objective to be the search for mineralized zones and the increase of the geological knowledge. This is because this region standouts as one of the most perspective areas for the search of favorable zones of gold mineralization and other metals (Czhestakanova, 1966; Shevchenko et al., 1979; Ovchinikov et al., 1981; Tchounev et al., 1981; Iturralde-Vinent et al., 1986; Durañona et al., 1990; Capote et al., 1991; Piñero et al., 1992; Pimentel et al., 1992, 1993; Capote, 1999; Capote et al., 2002, 2005; Donet et al., 2014; Cazañas et al., 2014).
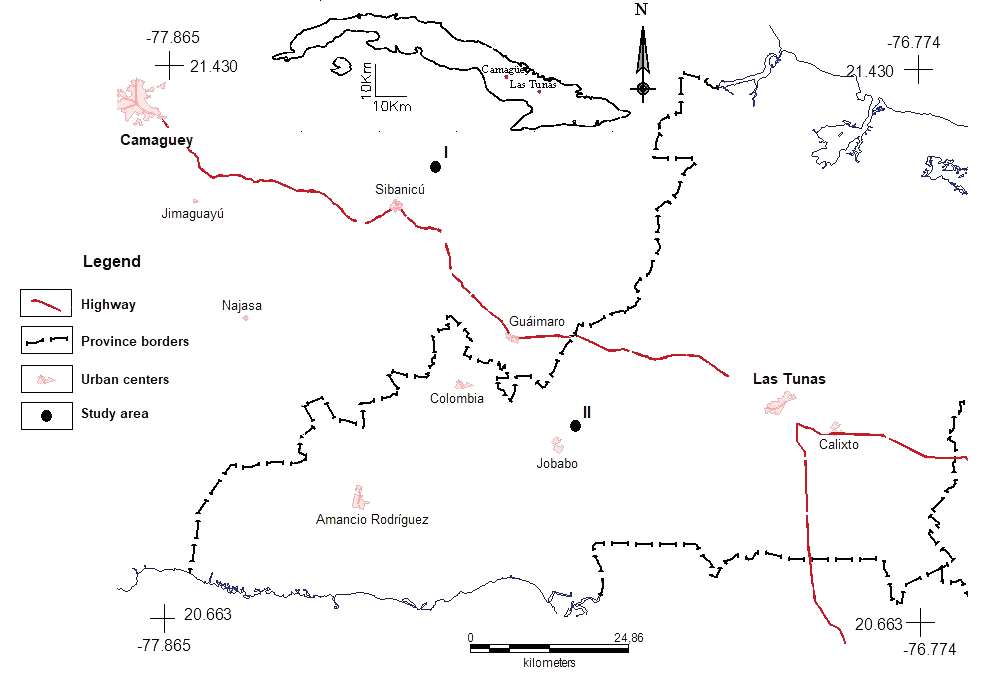
In the region of the CVA, different mineral deposits of diverse genesis are developed, such as: La Unión porphyry Au-Cu deposit (exploration by Mineral Siboney Goldfields-Geominera S.A. from 1994 to 1996, Alonso et al., 2001, Ulloa et al., 2011), Jacinto and Golden Hill (GH) mineral (field Figure 1, epithermal origin with low and high sulfidation, respectively). These were selected in the present research as study area because they are economically the most important for gold mineralization into the CVA region (Ovchinikov et al., 1981; Tchounev et al., 1981; Iturralde-Vinent et al., 1986; Durañona et al., 1990; Pimentel et al., 1992, 1993, 2018; Meeling, 1996; Simon et al., 1999; Kesler et al., 2004; Piñero et al., 2008, 2011, 2021).
Besides, in other countries several investigations using VNIR/ SWIR (visible to near infrared / short-wave infrared) reflectance spectroscopy techniques have proven to be very useful for the rapid identification of hydrothermal alteration minerals (Thompson et al., 1999) for mineral exploration.
Since the creation of the various spectral libraries (usgs_min, jpl_lib, jhu_lib, igcp_lib, etc.), diverse software such as: ENVI, ERDAS, Spec_minTM, and others, are also useful for mineral discrimination based on their absorption features in different wavelength positions (Grove et al., 1992, Clark et al., 1993). Many authors have used these tools for various purposes Thompson et al., (1999), Ducart et al., (2006), Simpson, (2015), Arbiol and Lyne (2021), Wang et al., 2021, Zhou et al., 2022, Zhou et al., 2023, and others.
Jacinto deposit is a vein system (Figure 2) where Beatriz, Sur de Elena and El Limón Nuevo veins are the most prospective (Piñero et al., 2021). GH mineral deposit comprises three sectors (Figure 3), where Three Hill (TH) and Little Golden Hill (LGH) sectors are exploited. Big Golden Hill (BGH) sector is not yet exploited but there is a high degree of knowledge in its geological exploration phase (Pimentel et al., 2018).
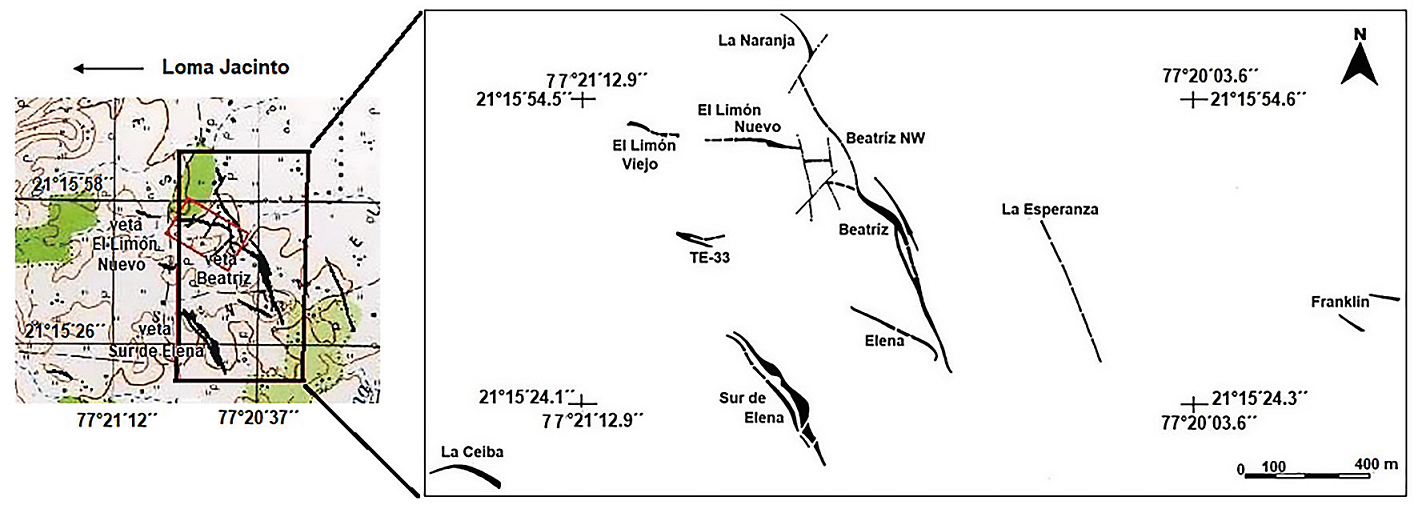
Figure 2 Scheme of distribution of the veins in the Jacinto deposit (modified from Simon et al., 1999; Kesler et al., 2004 and Piñero et al., 2011). The coordinate system used was GEODETIC WGS-84.
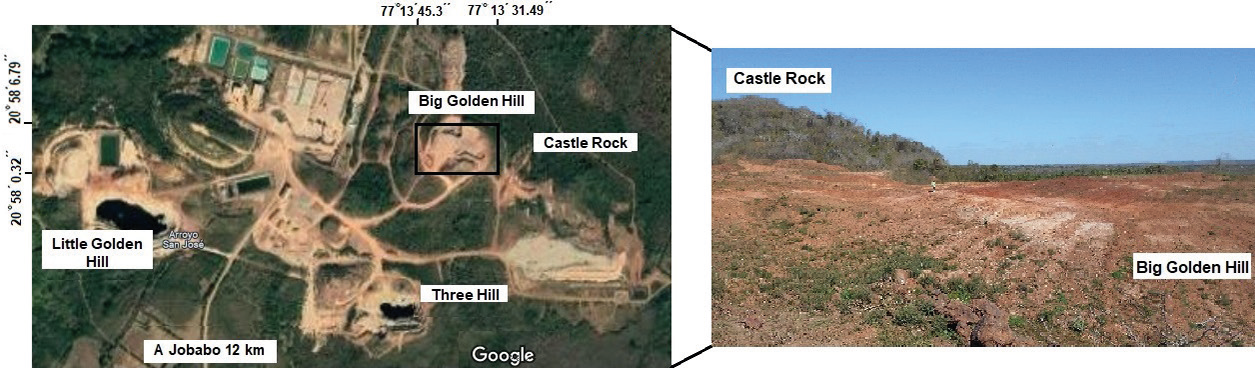
Figure 3 A-Location map of the GH mineral field and its three sectors. B- View of an outcropped area in the BGH sector. The coordinate system used was GEODETIC WGS-84.
The study area extends from Camagüey to Las Tunas provinces, territories belonging to the central-eastern region of Cuba (Figure 1). It is located approximately 29 km east of the City of Camagüey and reaches to 8 km to the east of the city of Las Tunas. The main access is through the central highway of Cuba, from which there are other secondary roads crossing it. The most important urban centers located within the area are Cascorro, Sibanicú, Amancio Rodríguez, Jobabo, Gúaimaro, Najasa, Colombia and the already mentiones city of Las Tunas.
Due to the economic importance of the study area, the main objective and contribution of this research is to deepen on the knowledge of the región and to apply of spectral pattern analysis as a preliminary method of approximation to differentiate, from spectral pattern, between phases of alteration in both deposits in Cuba. Spectroscopic measurements techniques have not been applied before for these purposes either in the study areas or in the Cuban national territory.
In Cuba, the use of remote sensing techniques, as an efficient way of capturing information for the study of altered mineral zones, has not been widely explored, so the present research seeks to provide, a step forward into a methodological way for its the knowledge, management, and application and to be effectively introduced into the geological investigation.
1.1Study areas
1.1.1 Jacinto deposit
The Jacinto deposit is developed in the form of stockwork of a vein system, which are named as Beatriz, Beatriz NW, Sur de Elena, Elena, El Limón Nuevo, La Ceiba, El Limón Viejo, Franklin, La Esperanza, TE-33 and La Naranja (Figure 2). The Beatriz, Sur de Elena and El Limón Nuevo veins were the most studied localities and the focus in this work (Piñero et al., 2011, 2021). The Beatriz and Sur de Elena veins are located about 2.5 km southeast of Loma Jacinto and cover an area of 0.715 km2 (71.5 ha). El Limón Nuevo vein is about 2.5 km SE of Loma Jacinto and covers about 0.115 km2 (11.5 ha). (Piñero et al., 2021).
1.1.2 Big Golden Hill sector
The Big Golden Hill sector is an exploitation concession and one of the three main sectors of the GH mineral field, together with LGH and TH (Figure 3). It is located 8 km NE of the town of Jobabo and occupies an area of 0.08 km2 (8.0 ha). (Pimentel et al., 2018).
1.2 Geological setting of the Camagüey - Las Tunas
Two structural levels are recognized - the folded substrate or Caribbean Plate (CARIB) and the neoautochthonous or cover terrain (Iturralde-Vinent, 1996). The first of these is exposed through the CVA and the sedimentary deposits of the Late Campanian-Maastrichtian-Upper Eocene that overlay it. The predominant mineralization in the CVA is epithermal occurring in various levels of the volcano-sedimentary column. The lithological units, linked to epithermal mineralization, are Crucero Contramaestre Formation (cct k2 - k5-1) in the case of Golden Hill and Camujiro (cjo k1-2) and La Sierra Formation (ls k2) to Jacinto deposit (Iturralde-Vinent et al., 1986; Piñero et al., 1992; Kesler et al., 1994; Simon et al., 1999). It is characterized by a great lithological variety in both the plutonic and volcanic-sedimentary complexes with ages ranging from the Lower Cretaceous (Neocomian) to the Upper Cretaceous (Campanian). It was described by four phases of magmatism, according to their petrographic, petrochemical, spatial and temporal distribution (granosienitic, granodioritic, plagiogranitic and alkaline leucocratic granites (Maraguan granites) complex, being the first three the most important and less important the last one (Pérez and Sukar 1994).
1.3 Geological characteristics
1.3.1 Jacinto deposit
It has been classified as a low sulfidation deposit (LS) of the Au-Ag adularia - sericite type (Simon et al., 1999). Gold is present in the native form and occurs in quartz associated to its crystalline structure. The silver contents are negligible.
Piñero et al., 2021 describe the layer texture in samples from the Jacinto veins. Their study allowed them to differentiate between five main stages, separated by brecciation. Stage I contains gold, and it is composed of microcrystalline to finely granular quartz with a massive or brecciated texture. Stage II contains gold, and it is composed of layers of microcrystalline to finely granular quartz and adularia, alternating with layers of microcrystalline to coarsely granular quartz. Stage III contains gold, and it is characterized by layers of calcite and microcrystalline or finely granular quartz in a stratified or massive texture. Stage IV is sterile in gold, and it is composed of microcrystalline to coarsely granular quartz, with less calcite and adularia. Stage V is composed of massive calcite.
The key minerals of the proximal alteration zones are sericite, quartz and pyrite cut by adularia and quartz. The gangue minerals are calcite, adularia, and gypsum in smaller quantities.
The Jacinto deposit is hosted by the Camujiro and La Sierra Formations (Figure 4). The Camujiro Formation (cjo k1-2 - Upper Cretaceous, Cenomanian and Upper Cretaceous, Turonian) is constituted by volcanic breccias, lavas, clastic lavas, tuffs and agglomerative tuffs; all of them display a variable composition, with dominant alkaline and calc-alkaline rocks; lavas from trachybasalt and shoshonites to trachyandesites, sandy and detritic limestones (de Huelbes and Bernal, 2013).
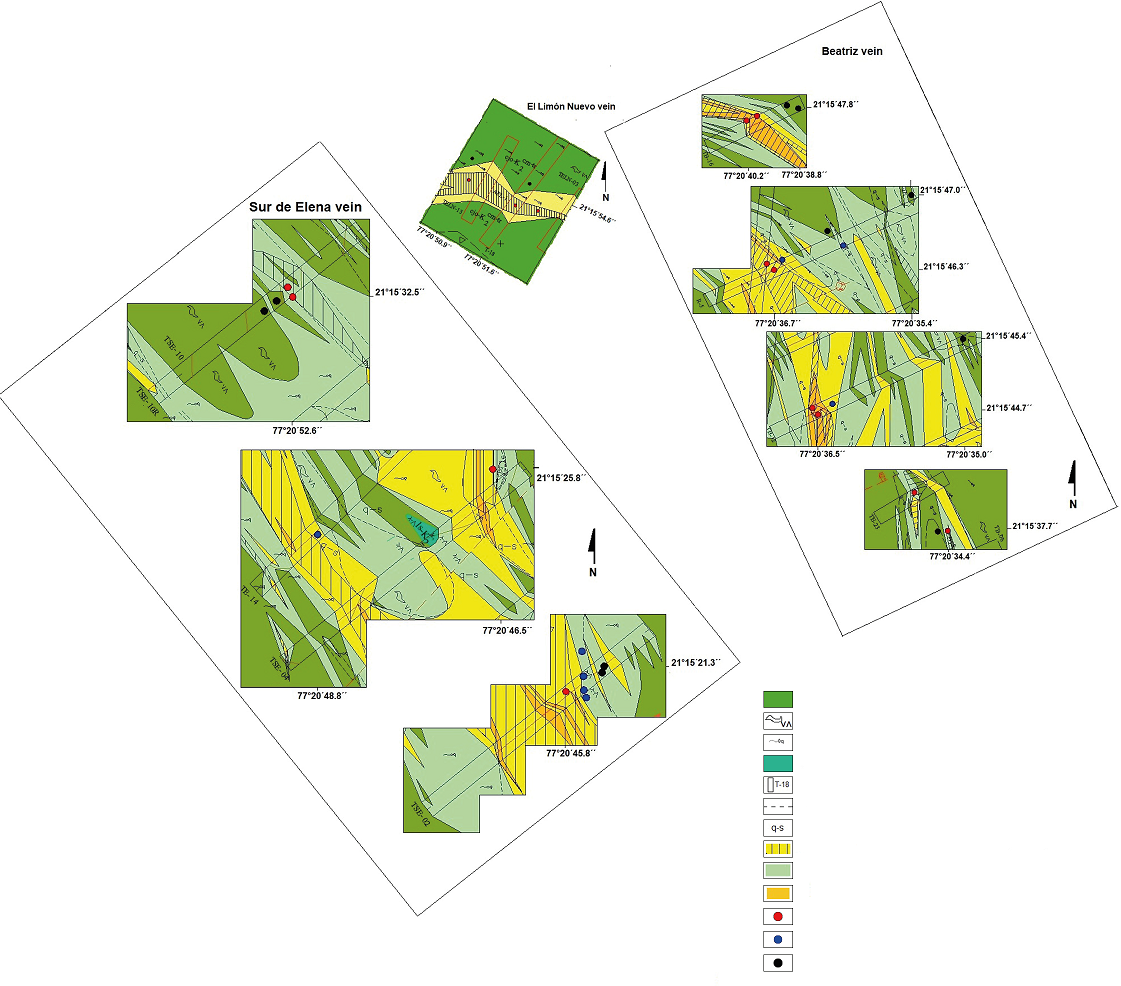
Figure 4 Geological map and sections of the sampling locations of Jacinto deposit (El Limón Nuevo, Beatriz, and Sur de Elena veins) (modified from Piñero et al., 2011, 2021). The coordinate system used was GEODETIC WGS-84. The location of the samples is shown in the Table 1.
The rocks of the Camujiro Formation are propylitized and tectonic, forming green-colored breccias, without mineralization. These serve as host rocks to quartz veins with a predominant brecciated texture and, to a lesser extent, massive texture, with low-sulfidation epithermal gold mineralization of the adularia-sericite type.
In the north-northwest portion of the sector, the La Sierra Formation (ls k2 - Upper Cretaceous, Campanian) appears, consisting of lavas and lava breccias with K-alkaline rhyolitic, rhodacytic, and dacitic composition (de Huelbes and Bernal, 2013). In altered (argillitized) sections, these appear as cutting bodies with a northwest direction.
Piñero et al., (2021), suggests that these intrusions have created conditions or conduits for Jacinto hydrothermal system. The hydrothermal alterations have affected the rocks of the Camujiro Formation, giving rise to zones of argillic and propylitic alteration, which may be associated with epithermal vein systems of precious metals, as observed in the case of Jacinto.
Regarding the host rocks, hydrothermal alterations have affected the rocks of the Camujiro Formation, giving rise to quartz-sericite and propylitic alteration zones, which are associated with the veins under study. Piñero et al., (2008, 2011, 2021) determined from petrographic studies of thin sections and mineralogical analyses that the host rock contains sericite, quartz, and pyrite, cut by adularia and quartz near the veins. Additionally, another assemblage is represented by illite-sericite-quartz, without pyrite. Outside the illite-sericite zone, there are propylitic assemblages in which plagioclase has altered to chlorite, albite, and calcite, and amphibole and pyroxene have altered to chlorite.
Piñero et al., (2021) determined that the main indicators and criteria for mineralization include outcrops of the mineralization (quartz with brecciated and massive textures, sometimes banded) (Stage I) and alteration zones characterized by the presence of sericite, quartz, and pyrite. The illite-sericite assemblage is followed by propylitic assemblages.
Piñero et al., (2008, 2021) describe that the mineralization process in the Jacinto deposit is divided into two phases: endogenous, in which magnetite is first associated with the host rocks, and then the epithermal mineralization begins to play part where pyrite, chalcopyrite, sphalerite, galena, gold and tetrahedrite appear. The second phase is hypergenic and is represented by goethite and hematite and other iron oxides and hydroxides.
Table 1 Jacinto deposit. Geographic coordinates of the sample rocks.
| Veins | Number of samples | Latitude N | Longitude W |
| Beatriz | |||
| Phase I | B-1 (TB-16*) | 21°15´47.8´´ | 77°20´39.2´´ |
| B-1a (TB-16*) | 21°15´47.7´´ | 77°20´39.2´´ | |
| B-5 | 21°15´46.3´´ | 77°20´36.7´´ | |
| B-5a (R-5*) | 21°15´46.4´´ | 77°20´36.8´´ | |
| B-8a (TB-12 sup*) | 21°15´44.8´´ | 77°20´36.5´´ | |
| B-9a | 21°15´44.7´´ | 77°20´36.5´´ | |
| B-13 (TE-23 sup*) | 21°15´37.7´´ | 77°20´33.4´´ | |
| B-14 (TE-23 trench*) | 21°15´38.0´´ | 77°20´33.7´´ | |
| Phase II | B-6 | 21°15´46.4´´ | 77°20´36.6´´ |
| B-6a (R-5*) | 21°15´46.5´´ | 77°20´36.0´´ | |
| B-8b (TB-12 sup*) | 21°15´44.8´´ | 77°20´36.3´´ | |
| Phase III | B-2 (TB-16*) | 21°15´47.8´´ | 77°20´38.9´´ |
| B-3a (TB-16*) | 21°15´47.8´´ | 77°20´38.8´´ | |
| B-7 (R-5*) | 21°15´46.7´´ | 77° 20´36.2´´ | |
| B-7a (R-5*) | 21°15´47.0´´ | 77°20´35.4´´ | |
| B-9-1 | 21°15´45.4´´ | 77°20´35.0´´ | |
| B-12 | 21°15´37.6´´ | 77°20´33.5´´ | |
| Sur de Elena | |||
| Phase I | SE-5 (TSE-02*) | 21°15´23.0´´ | 77°20´45.7´´ |
| SE-7 (TSE-04*) | 21°15´25.8´´ | 77°20 ´46.5´´ | |
| SE-8a (TSE-10*) | 21°15´32.4´´ | 77°20´ 52.5´´ | |
| SE-9ab (TSE-10*) | 21°15´32.5´´ | 77°20´52.6´´ | |
| Phase II | SE-4 | 21°15´23.3´´ | 77°20´45.6´´ |
| SE-6 (TE-14*) | 21°15´24.0´´ | 77°20´48.8´´ | |
| SE-3a (TSE-02*) | 21°15´21.3´´ | 77°20´46.4´´ | |
| SE-3b (TSE-02*) | 21°15´23.0´´ | 77°20´45.6´´ | |
| SE-3c (TSE-02*) | 21°15´23.0´´ | 77°20´45.6´´ | |
| Phase III | SE-1 (TSE-02*) | 21°15´21.3´´ | 77°20´46.4´´ |
| SE-2 | 21°15´21.3´´ | 77°20´46.4´´ | |
| SE-8c (TSE-10*) | 21°15´32.3´´ | 77°20´52.8´´ | |
| SE-9c | 21°15´30.5´´ | 77°20´53.5´´ | |
| El Limon Nuevo | |||
| Phase I | ELN-10 | 21°15´54.4´´ | 77°20´51.6´´ |
| ELN-10a | 21°15´54.1´´ | 77°20´51.3´´ | |
| ELN-10a-1 | 21°15´54.1´´ | 77° 0´50.9´´ | |
| Phase III | ELN-11a | 21°15´54.6´´ | 77°20´51.6´´ |
| ELN -1a-1 | 21°15´54.4´´ | 77°20´50.9´´ |
Previous petrographic analyses (Piñero et al., 2008, 2011) described areas with predominant minerals of propylitic alteration, such as quartz, carbonate, sericite, chlorite, epidote. In thing sections, the adularia potassium feldspar appeared, thus corroborating the interpretation of Simón et al., (1999) concerning deposits of epithermal low sulfidation with adularia.
1.3.1.1 Beatriz vein
Beatriz vein in the center of the Jacinto deposit (Figure 2), with a course development of approximately 600 meters. It develops from the center from where a branching occurs that gives rise to three veins (A, B and C), linked to three mineralized zones of the same name, and characterized by quartz + intense silicification + calcite, accompanied by alteration zones argillic quartz-sericitic-kaolinitic, limonitization and hematitization, with oxidized and leached sulfides. The gold content may also appear associated with a gray to whitish gray breccia that forms from a silicified and tectonized part of the sericitic quartz rock, closely related to the quartz vein.
Piñero et al., (2021) in mineralogical studies showed that the phases were maintaining crystalline and amorphous quartz, plagioclase, chlorite, sodium and potassium feldspar, the adularia crystalline phase, pyroxene, micas, calcite, Fe oxides, pyrite and chalcopyrite, and clays (as Montmorillonite + Illite and Chlorite + Montmorillonite). Gold is associated with quartz of > 0.03 mm in size. Previous results of Scanning Electron Microscopy indicate that the dimensions of the particles can reach an average value of 5.1 µ.
An initial macroscopically description revealed that the mineralization is associated with the stage I, describe previously. Surface samples are taken close to the trenches made in the vein.
1.3.1.2 Sur de Elena vein
Piñero et al., (2021), indicated that the vein is in an undulating relief approximately 500 meters SW of the Beatriz vein and heading parallel to it and it is composed of white to gray quartz and calcite. The vein is highly tectonized and limonitized, accompanied by a quartz-sericitic-kaolinitic alteration zone, limonitized and hematized, with oxidized and leached sulfides.
The vein reaches its greatest development as a vein and mineral zone towards the central part. It has an irregular shape, its widest part is in the southeast, then it branches into two that continue intermittently to the northwest. Similar characteristics of geological structure and mineralization are observed throughout the vein.
Gold mineralization could link to quartz + calcite veins with breccia and/or massive texture accompanied by zones of argillic alteration (quartz - sericitic - kaolinitic?) limonitized and hematized. The mineralization carrier is also the gray breccia forming from the silicified and tectonized quartz-sericitic rock, with few sulfides.
A first inspection of material revealed the presence of silicified, hematized quartz, sericitic quartz veins, breccia texture, calcite may appear. The vein appears in a trench and outcrops in surface. Towards the ends, appear the volcanic rock that extends to the outermost part of the vein and belongs to the propylitic alteration.
1.3.1.3 El Limón Nuevo vein
The center of the vein is delimited by the TE-18 trench (Piñero et al., 2011), located at a slight elevation, to the W of the Beatriz vein (Figure 2). It is composed by a vein of white quartz where gold can also appear associated with a gray to whitish-grey breccia that forms from a sericitic quartz rock, in parts silicified and tectonized, with up to 5% of sulfides, in close relationship with the quartz vein, belonging to stage I. It belongs to the Camujiro Formation. The mineral accumulation has a length of 260 m. The rocks are propylitized and tectonized, forming green colored breccia, without mineralization and of broad development.
An initial revision of samples revealed the presence of white quartz with large clasts of gray vulcanites, almost perfect breccia texture and massive texture. The vein is found in trench and outcrops at the surface. Vulcanites appear at the ends of the vein.
1.3.2 Big Golden Hill sector
The Golden Hill mineral field is classified as high sulfidation (HS) pyrite-enargite type. The gold mineralization is associated with the advanced argillic hydrothermal alteration phase. The primary ore is massive and scattered sulfides, pyritic, overlaid by the oxidized ores. (Pimentel et al., 2018).
The element association indicates hypogenic (Au-Cu) and supergenic (Au-Ag) features. The hydrothermal alteration phase is associated with the vesicular quartz and quartz-alunite facies in the center-west of the area, to the quartz-pyrophyllitic facies in the southeast, which are enveloped by argillic alteration and this in turn by propylitic. The key metallic minerals in the hypogenic phase includes pyrite, enargite, chalcocite, with Au disseminated within pyritic ore, whereas in the supergenic phase appears native Au. The key minerals in the proximal alteration include quartz, kaolinite, alunite, pyrophyllite, and diaspore, where the gangue minerals are hypogenic (quartz, kaolinite, alunite, pyrophyllite, and diaspore) or supergenic (hematite, goethite, jarosite, and quartz) specimens.
The BGH sector (Figure 5) belong to the Crucero-Contramaestre Formation (cct k2-k51- Upper Cretaceous, Turonian and Upper Cretaceous, Lower Campanian), that consists of tefroid sandstones, conglomerates, gravelites, tuffs, limolithic tufites, silicified limestones, gray silicites, lavobreccias, andesites, basalts, and basalt-andesites (de Huelbes and Bernal, 2013).
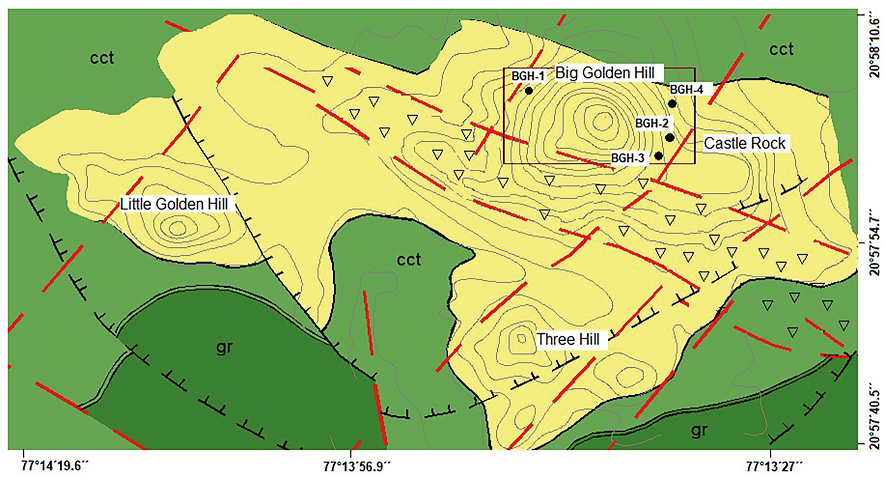
Figure 5 Geological map and sampling locations of BGH sector. (modified Pimentel et al. 2018). The Coordinate system used was GEODETIC WGS-84, red box: BGH sector study area, black dot: sampling points, dashed red lines: faults, cct: Crucero-Contramaestre Formation, gr: Guaimaro Formation, light yellow color: Golden Hill mineral field limits: inverted triangle: alunite zone, dashed black lines with perpendicular black lines: circular structure Golden Hill. The location of the samples is shown in Table 2.
2. Materials and Methods
As it was before mentioned, the main objective of this work has been to carry out the spectral differentiation and characterization of the main alteration zones or phases of mineral deposits using a portable spectroradiometer or VNIR-SWIR. This is an internationally well-known technique applied in Cuba for the first time. The materials used as well as the methodology conducted are as described below. The research scheme was divided into three stages (Figure 6).
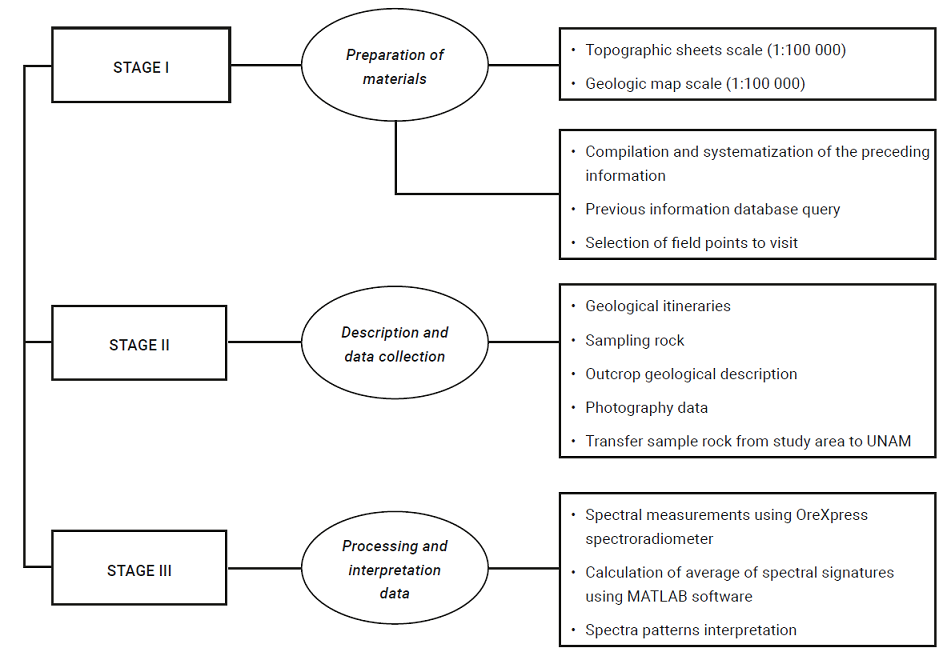
Stage I: Data preparation. Geological and topographic sheets at a scale of 1:100,000 (Institute of Geology and Paleontology (IGP), 2015) and previous geological information described in geological reports of both deposits (IGP, ONRM, Empresa Geominera Camagüey) were revised and compiled into a database, in order to select the fieldwork itineraries and sampling points. These were established according to previous geological information and prior meetings and consultation with specialist colleagues related to the study areas with a previous geological exploration work in these mineral deposits.
Stage II: Description and data collection. A detailed geological description about rock types and alteration phases, (Figures 4 and 5) from the wall of the trench into the veins and photographs of the outcrops were the data collected during the fieldwork. Samples collected in Cuba were analyzed at the laboratory in the Institute of Geophysics, UNAM, for petrographic, and chemical analysis. However, XRD analysis were not possible to be carried out due to the start of the pandemic. The minerals identified using OreXpress (OXps) for each alteration phase, were correlated to those described by Piñero et al., 2008, 2011, 2021, and Pimentel et al., 2018.
Table 3 shows the total number of samples taken during the fieldwork for each alteration phase which allowed to differentiate the position of the absorption features into the electromagnetic spectrum.
Table 2 Big Golden Hill sector. Geographic coordinates of the sample rocks.
| Number of samples | Latitude | Longitude |
| BGH-1 | 20° 58´ 03.2´´ | 77° 13´ 44.6´´ |
| BGH-2 | 20° 57´ 58.4´´ | 77° 13´ 44.6´´ |
| BGH-3 | 20° 57´ 57.9´´ | 77° 13´ 32.8´´ |
| BGH-4 | 20° 58´ 01.8´´ | 77° 13´ 29.0´´ |
Table 3 Technical features of the OXps portable spectrometer.
| Deposit | Sector | Alteration phases | Number of samples |
| Jacinto | Beatriz vein (B) | Phase I | 8 |
| Phase II | 3 | ||
| Phase III | 6 | ||
| Sur de Elena (SE) | Phase I | 4 | |
| Phase II | 5 | ||
| Phase III | 4 | ||
| El Limón Nuevo (ELN) | Phase I | 3 | |
| Phase III | 2 | ||
| BGH | 4 | ||
| Total of samples | 39 |
Stage III: Data processing and interpretation. Spectral measurements using OXps portable spectroradiometer were carried out at the Laboratorio de Petrografía y Microtermometría (Laboratory of Petrography and Microthermics), belonging to the Departamento de Recursos Naturales (Department for Natural Resources) of the Instituto de Geofísica, Universidad Nacional Autónoma de México (UNAM), directly using the natural daylight and environment conditions.
With OXps portable spectroradiometer, model SM-500, was used to obtain the spectral evolution of each sample. The equipment measures wavelengths in a range from 350 to 2500 nanometers in the full range of the electromagnetic spectrum. Some technical features of the OXps portable spectrometer are shown in Table 4 (https://spectralevolution.com/products/hardware/field-portable-spectrometers-for-mining/orexpress/). Samples were analyzed from the freshest and least weathered side. An average of 5 measurements were made per each sample, according to the different lithological or hydrothermal alteration phase type, in order to cover the entire area and to make it as representative as possible.
Table 4 Minerals identified with the OXps spectroradiometer according to alteration phases.
| Technic specifications | |
| Spectral range | 350-2500nanometers |
| Spectral resolution | 3nanometers (350-1000nanometers)
9nanometers @1500nanometers 6.5nanometers @2100nanometers |
| Spectral sampling bandwidth | 1.5 nanometers (350-1000nanometers)
3.8nanometers @1500nanometers 2.5nanometers @2100nanometers |
| Wavelength reproducibility | 0.1 nanometers |
| Wavelength accuracy | ±0.5 bandwidth |
2.1 Equipment calibration
Once the equipment was turned on, the DARwinSP with a USGS database incorporated for the interpretation of the spectra software activated. After the machine-equipment connection activated, a window opened and through Bluetooth the EZ software-ID openned. To start the spectral measurements, it is important to calibrate the equipment. For doing this, the position of the head on the Spectralon plate (white reference), must be on a clean surface. After the measurement, its spectrum appears on the screen, and the equipment calibrates to begin the measurements.
2.2 Spectral measurements
The calibration window is switched to the target. The head is placed in the position of the angle to be measured in the direction of the sample and the signal is executed on the monitor. Measured spectrum is shown on the monitor and on the right side appears its reflectance value and wavelength. The information is included into a file X.sed, and it is opened in a software like ENVI, Specmin_home, and so on, to work with it. Additionally, copying the wavelength and reflectance values to a spreadsheet and plotting the spectra is also possible.
2.3 Matching with EZ-ID software
Once this software opened and the sample measured, two spectra signatures are offered. One belongs to the sample (blue color) and the other to the USGS software library (red color) with the percentage of the mineral correlation between them (from a maximum to a minimum values), as well as a list of minerals to which it could correspond and that begins with the highest association (≥ 90%), depending on the absorption features present at different position of wavelengths, in the short infrared region, mainly due to alteration minerals. This window also shows the place of origin from where the samples are taken from which their spectrum was established as a reference into the library.
The final spectrum that identifies each of the hydrothermal alteration phases per deposit (Figure 7) is defined from the average of the measurements belonging to each hydrothermal alteration phase. It is considered that the association grade between the spectrum of the mineral, obtained from the measurements with the spectroradiometer, and that reported in the spectral library database was ≥ 90%. The calculation process has been carried out for 195 measurements using the MATLAB software (R2019a-student license). The spectra patterns interpretation has contemplated a visual analysis considering the shape and depth of the absorption features and the reflectance value.
3. Results and Discussion
Through the processing and interpretation of spectral information, the three main alteration zones or phases, previously identified by Piñero et al., 2008, 2011, 2021, based on geological exploration research carried out in the Jacinto deposit, could be well differentiated. Additionally, the advanced argillic alteration phase for the BGH sector was reaffirmed according to the spectral data too, with the presence of minerals characterizing it, such as pyrophyllite, as it was also described by Pimentel et al., 2018. The description of these alteration phases or zones is provided below.
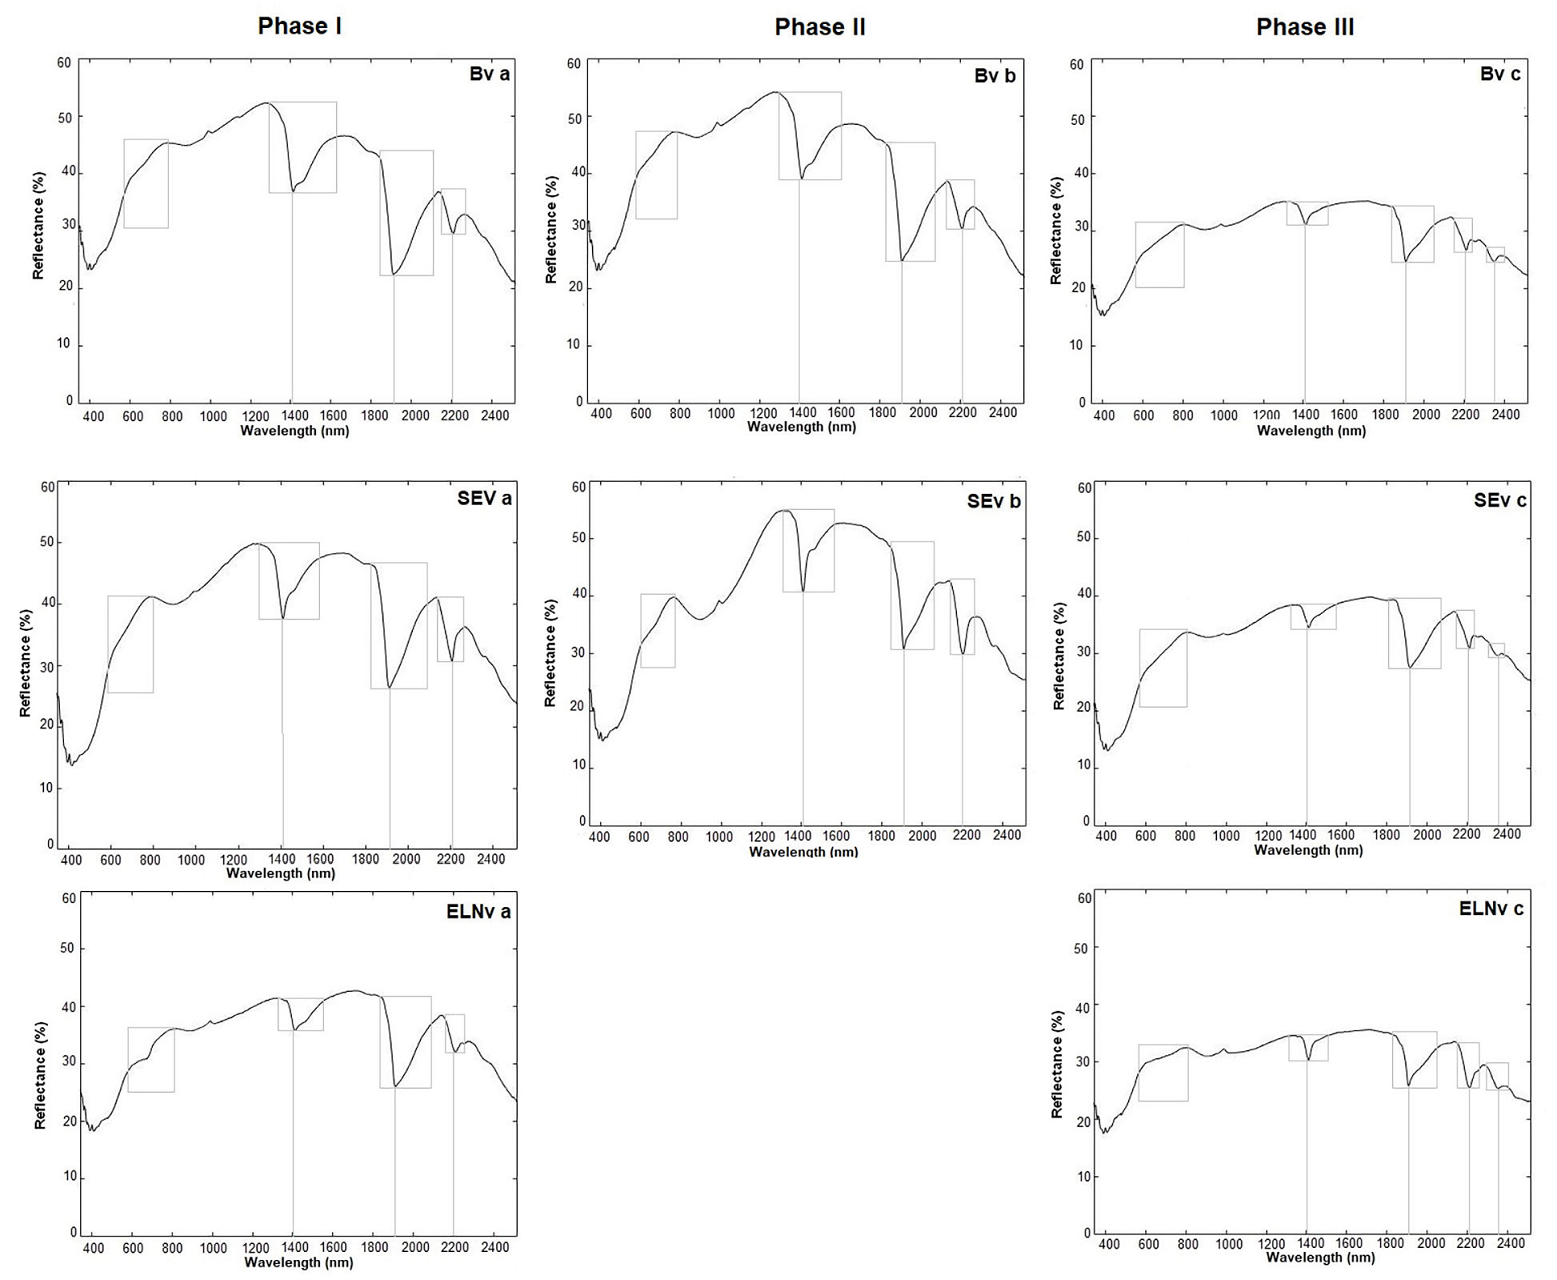
Figures 7 and 8 show the light gray boxes with dashed lines corresponding to the average absorption positions performed with the OXps on the samples along the entire spectrum. The boxes at the 1400, 1900 and 2200 nanometer wavelength position represent the absorption features, which are attributed to the presence of clay minerals, such as: montmorillonite, nontronite. That position is the most distinctive pattern to differentiate the hydrothermal alteration phases considering its shape and width.
3.1 Jacinto deposit
It is characterized by the presence of three main hydrothermal alteration phases or zones (Figure 7). A detailed description of the spectral signature that allows to differentiate and characterize each alteration phase are shown in Table 6 and Figure 11.
(a) Phase I - Associated with the lithological type of quartz with massive and/or brecciated textura, named as Stage I from Piñero et al., 2021. Results are shown in Figure 7 (represented by the letter a). In this phase, four absorption features along the spectral signatures are present in all veins. The spectral signature in the visible region between 600 - 800 nanometers is represented by the presence of goethite as an iron hydroxide as described by Piñero et al., 2021. This pattern is less represented into the ELN vein. A distinctive feature in all veins occurs at 1400, 1900 and 2200 nanometers, which responds to the presence of clay minerals, such as: montmorillonite, nontronite which belong to smectite group, identified in Table 5, although the shape and depth of peak is different (box with gray continuous line). The reflectance value in this position is less than 30 % from the lower part of the absorption feature at 1900 nanometers, until 50 % although in the ELN vein. This pattern was very different, which allowed to differentiate among the rest of the veins, with values from near to 30% to 40%.
(b) Phase II - There is an alteration zone with the presence of quartz-sericite or silicified, limonitized, and hematitized, linked to the argillic alteration phase, where the main minerals characterizing it are kaolinite, montmorillonite, smectite (https://www.ugr.es/~minechil/apartado14.htm). Results are shown in Figure 7 (represented by the letter b). This phase does not occur into the ELN v. Four absorption features are present in the Bv and Sev, along the spectral signatures in the wavelength range. The spectral signature in the visible region between 600 - 800 nanometers is represented by the presence of goethite and limonite as an iron oxide and hydroxide. A distinctive feature occurs at 1400, 1900 and 2200 nanometers, which results from the presence of clay minerals, meanly by the montmorillonite as representative mineral in argillic alteration phase, beside of halloysite and may be nontronite which belong to smectite group, identified in Table 5. The reflectance value in this position is nearly 30 %, until more than 50 %.
It is important to emphasize that the difference between this phase and the previous one is evident at 1400 nanometers, where the amplitude and shape of the absorption feature at that position are illustrated in Figure 7.
(c) Phase III - Alteration zone proximal to the volcanic rock represented by the presence of illite-sericite-quartz assemblages, without gold content, near the propylitic alteration zone. Results are shown in Figure 7 (represented by the letter c). The spectra of this alteration phase are characterized by five absorption features along the wavelength range. The spectral signature in the visible region between 600 - 800 nanometers is represented by the presence of goethite as an iron hydroxide. A distinctive feature occurs at 1400, 1900 and 2200 nanometers, which respond to the presence of clay minerals such as montmorillonite, illite and nontronite which belong to smectite group, identified in Table 5. The most pronounced spectral feature occurs at 1900 nanometers. The reflectance value in this position is nearly 30 % at 1900 nanometers, until more than 40 %.
Table 5 Type of mineralization and its relationship with the values of the absorption features.
| Ore deposit | Minerals |
| Jacinto | |
| Phase I | Montmorillonite, heulandite, laumontite, nontronite, goethite |
| Phase II | Montmorillonite, goethite, laumontite, halloysite, nontronite, stilbite, limonite |
| Phase III | Montmorillonite, goethite, illite, rhodonite, nontronite |
| Big Golden Hill sector | Goethite, nontronite, pyrophyllite, anorthite |
Table 6 Type of mineralization and its relationship with the values of the absorption features.
| Hydrothermal alteration phases | Range of wavelength position versus depth (nanometers) | |||||
| Jacinto (LS) | ||||||
| Phase I | 600-800 | 1270-1650 | 1830-2150 | 2150-2260 | ||
| 1400 | 1900 | 2200 | ||||
| Phase II | 600-800 | 1300-1580 | 1840-2100 | 2130-2270 | ||
| 1400 | 1900 | 2200 | ||||
| Phase III | 600-800 | 1360-1545 | 1840-2110 | 2130-2240 | 2280-2370 | |
| 1400 | 1900 | 2200 | 2340 | |||
| Big Golden Hill (HS) | ||||||
| Oxidized zone | 600-750 | 1360-1550 | 1730-1840 | 1870-2080 | 2120-2230 | 2270-2340 |
| 1400 | 1900 | 2170 | 2200 | 2320 | ||
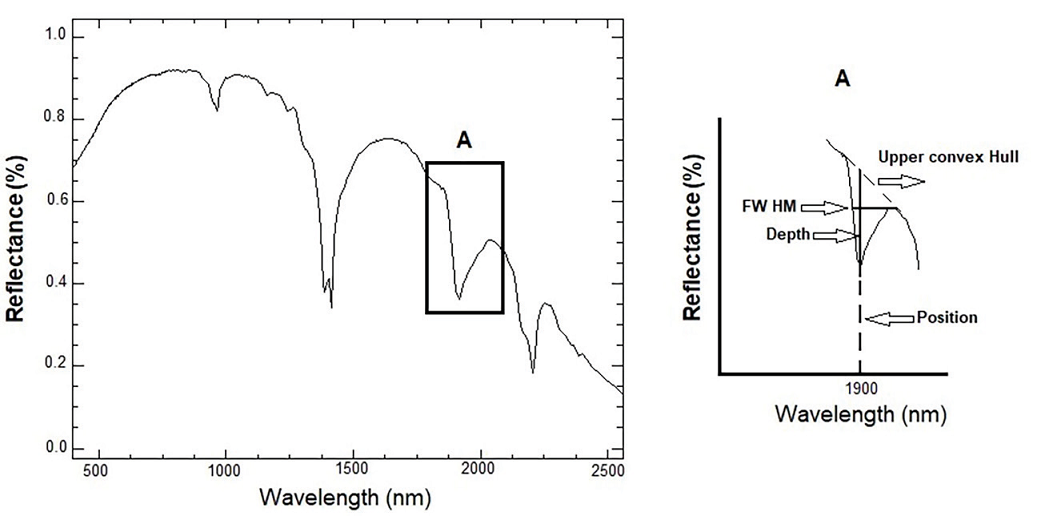
Figure 9 Example of spectrum curve. Detail A shows Hull’s feature, depth, position, and FWHM (adapted from Thompson et al., 1999).
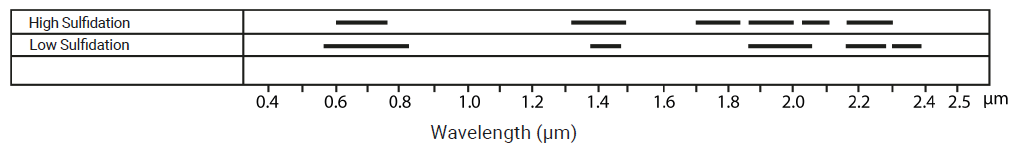
Figure 10 Types of epithermal deposits and their relationship with absorption areas (indicated in black lines) in the wavelength position, according to the spectrum of the alteration mineral.
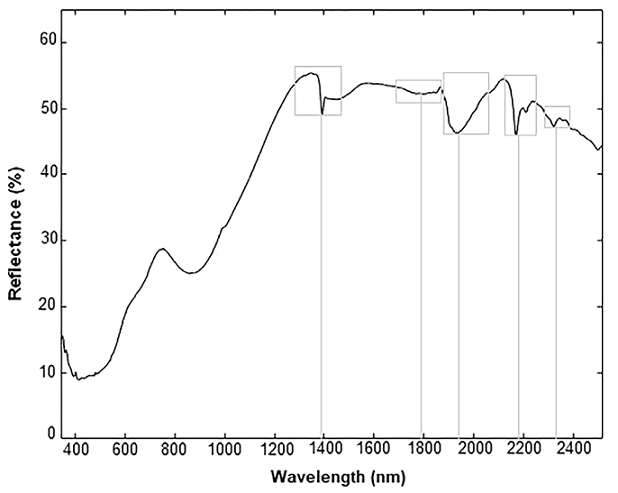
3.2 Big Golden Hill sector
Figure 8 shows the six absorption features in the wavelength ranges from 600 to 2320 nanometers. The signal observed in the range 600-750 nanometers defines the response for iron oxide and hydroxide minerals, characterized by the presence of goethite in the gossan. The maximum reflectance value is 55%. The value of the absorption features for this spectrum is reported in Table 6 and Figure 11.
Once the spectra for each vein and sector were obtained, specific to each phase of hydrothermal alteration, the next task was to establish those the minerals identified with the spectroradiometer characterizing each of the veins of the Jacinto deposit and the BGH sector.
Table 5 shows a general description to all minerals identified with the OXps spectroradiometer for each hydrothermal alteration phase present in the different veins and the sector, respectively. These are in correspondence with the geological description in Piñero et al. (2008, 2011, 2021) which determined that the predominant minerals for the low sulfidation system were montmorillonite, stilbite, goethite, laumontite, halloysite, illite, rhodonite, nontronite, muscovite, and limonite.
Pimentel et al. (2018) described in the high sulfidation system that the minerals present were goethite, pyrophyllite, nontronite and, in a smaller proportion, Ca-rich plagioclase. Goethite has a marked representation in the visible region of the spectrum (Figure 8), typical for iron oxides - hydroxides. Pyrophyllite appears mixed with kaolinite, alunite, and quartz, which indicate a positive response as an alteration mineral, being associated with advanced argillic alteration to which the gold mineralization is related. On the other hand, the presence of nontronite, which belongs to the smectites group minerals, could be an indicator of this, also typical for high sulfidation deposits. The results show the efficiency to apply this kind of technique for this purpose.
In Figure 9 an example of the feature analysis of an absorption peak (Thompson et al., 1999) is displayed. Considering this principle, we proceeded to extract the wavelength range of each absorption signal in those spectra reported in Figures 7 and 8. The value of the amplitude of the absorption feature was determined empirically from a visual analysis of the spectrum, considering the Upper convex Hull and the position in the wavelength value (Figure 9). The rest of the parameters explained in Figure 9A, such as position and depth of the absorption features were considered after a differentiation between the different hydrothermal alteration phases in each deposit.
Once the position of the absorption features in the electromagnetic spectrum was obtained, we defined the Upper convex hull and Full Width Half- Maximum (FWHM) for each one. The upper convex Hull was calculated as an enveloping curve on the pixel spectra having no absorption features. Next, the Hull-quotient reflectance spectrum was derived by taking the ratio between the pixel reflectance spectrum and the enveloping upper convex Hull. These Hull quotient spectra were used to characterize absorption features, known to be attributed to a certain mineral of interest, in terms of their position, depth, width, asymmetry, and slope of the upper convex hull (van der Meer, 1995). The absorption band position (λ) was defined as the band having the minimum reflectance value over the wavelength range of the absorption feature. The FWHM, in turn, was considered as the maximum width from one side to another into the absorption features.
Once the above mentioned parameters were defined, the next objective was to define the minimum and maximum range of the wavelength value of the absorption features into the spectrum. As reference, it was decided to take the Figure 10 from van der Meer et al., (2012) where the author shows the main mineral deposit types in relation to their wavelength position of the absorption feature related to the key alteration minerals. This figure was useful to corroborate if the position of the absorption features reported in Figure 10 are corresponded to those mentioned by the author as for low and high sulfidation mineralization and to validate the position obtained for each one.
According to van der Meer et al., (2012), the identification of signals in the infrared visible regions is useful to infer the presence of transition metal ions (e.g., Fe, Cr, Co, Ni). These absorption peaks are related to atomic electronic transitions. The presence or absence of water and OH ion, carbonates and sulfates could be determined by absorption features in the short infrared region. On the other hand, the depth in the absorption band is related to the size of the grain as the amount of light scattered and absorbed by a grain is dependent on its size.
Using the information of Figure 10 as a guide, the minimum and maximum amplitude values of the absorption features for each of the hydrothermal alteration phases have been identified and evaluated.
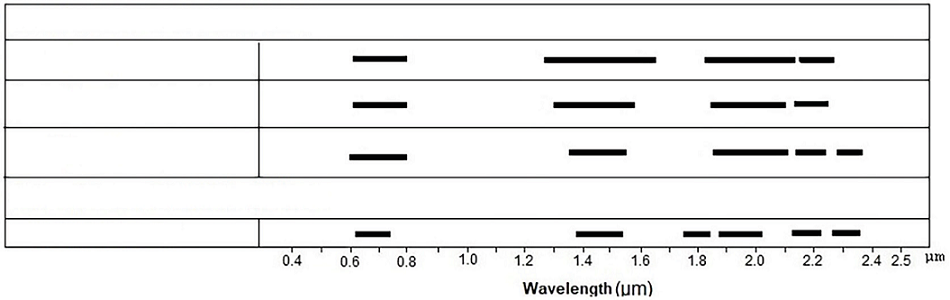
Figure 11 illustrates the wavelength position for each absorption feature present in the spectra defined with the spectroradiometer according to alteration phase. We can summarize the characteristic absorption features according to the alteration
phases present in each mineral deposit. The following wavelength values in the spectrum, considering the amplitude and the position of the depth, are shown in Table 6. This classification allows to differentiate and define the proper wavelength positions for each alteration phase, where, in addition, they differ in reflectance values, although it is not the most important distinctive feature to consider.
Table 6 summarizes the information regarding the type of study mineralization linked to the position of the absorption feature that differentiate each of the alteration phases. The ranges of values indicate the maximum width that the absorption feature occupies, and the lower value is the position of the feature in its central value of wavelength.
The veins of the Jacinto deposit are separated by means of three alteration phases described previously. This one can be differentiated using the measured spectral characteristics.
The alteration phase I is characterized by four absorption features with wavelengths positioned in 600, 1400, 1900, and 2200 nanometers, respectively. Phase II is characterized also by four absorption features from the visible near infrared, like phase I, but the difference is in the shape, width and depth of the feature as shown in the Figure 7. The phase III is characterized by five absorption features from 1360 to 2370 nanometers. (Table 6).
The oxidized ore in the high sulfidation deposit is characterized by the presence of six absorption features (Table 6) at different wavelength positions ranging from the visible to the infrared, where a well-pronounced feature corresponding to the presence of iron oxides-hydroxides was observed. Those minerals of goethite identified were linked to very distinctive features in the near infrared where it is inferred that it is mainly related to pyrophyllite, which is typical of advanced argillic hydrothermal alteration phase. In addition, there are highly distinctive features in the near and short infrared compared to the other lithologies.
4. Conclusions
Reflectance spectroscopy techniques, applied for the first time in Cuba, have allowed to differentiate and characterize different hydrothermal alteration phases linked to epithermal mineralization. Three alteration phases have been spectrally differentiated in the Jacinto deposit.
(a) Phase I - It is associated with the lithological type of quartz with massive and/or brecciated texture, where gold mineralization develops and is linked. It exhibits four absorption features. The feature at 600-800 nm is associated with the identified goethite mineral. The positions at 1400, 1900, and 2200 nm correspond to clay minerals identified as montmorillonite and nontronite, belonging to the smectite group. The reflectance value varies from under 30% at 1900 nm to a maximum of 50%. For the El Limón Nuevo vein, these fluctuate in the 30 to 40% range.
(b) Phase II - It is related to argillic alteration zone composed by sericitic or silicified quartz and ferrous minerals such as limonite and hematite. This phase only occurs the Beatriz and Sur de Elena veins. Four absorption features are distinguished. At 600-800 nm, it is associated with goethite and limonite. At 1400, 1900, and 2200 nm, clay minerals are linked. In this case, montmorillonite appears as the main mineral of the argillic alteration, along with others like halloysite and nontronite. The difference between Phase I and II lies in the amplitude and shape of the absorption feature at 1400 nm. The reflectance value ranges from around 30 to 50%.
(c) Phase III - It is an alteration zone near the volcanic rock, represented by illite-smectite-quartz arrangement, without gold content and close to the propylitic zone. Five absorption features are distinguished. The feature at 600-800 nm is associated with goethite. The positions at 1400, 1900, and 2200 nm correspond to clay minerals such as montmorillonite, illite, and nontronite.
The most pronounced feature is at 1900 nm. The reflectance values for all signals are around 30%, excepting for 1900 nm that reach 40%.
Alteration mineral arrangement of the Big Golden Hill sector is characterized by goethite and nontronite minerals, whose signals occur in the visible infrared region. In the rest of the spectrum have been detected absorptions linked to pyrophyllite, suggesting an advanced argillic alteration phase. The reflectance value reaches a maximum of 55%.

